All long term profitable strategies are very hard to trade due to the fact that draw down periods – deep and long – are inevitable in the long term and a lot of confidence and prior understanding is needed to trade through these periods without giving up on the trading strategy. This is the reason why I have always given a very high priority to the long term reliable simulations of mechanical trading strategies since these simulations give us extremely important information about our trading strategies and what happens when market conditions are not favorable for the systems we are using. When someone uses a long term reliable analysis of a strategy they are able to trade it without fear and greed since the long term profit and draw down characteristics are well known. On today’s post I will talk about a very important part of this analysis which has the job of giving the trader a good idea about what he or she should expect from short term trading results, today I will talk about monthly return analysis.
One of the biggest difficulties in using long term profitable strategies successfully is the large gap that lies between short and long term trading results. It is very difficult to think about the very long term and use a system that has long and deep draw down periods when actually facing the short term results. The problem here is that when a draw down period is entered the trader is faced with a dilemma that usually ends up with a system change, the trader needs to think about the short term as temporary and of the long term results as a goal. The opposite can happen with systems that are not long term profitable, a trader may use it because of short term results with a complete disregard for the unsound trading tactics being used that end up bringing a wipe-out to the trader’s account.
–
The cure that enables us to run long term profitable systems in spite of what may look like bad short term results is simply understanding, the understanding that such results are a normal part of the functioning of the trading system under a certain set of market conditions. But how do we reach this understanding and how can we have any predictive power around short term trading results ? This is where monthly return analysis comes into play.
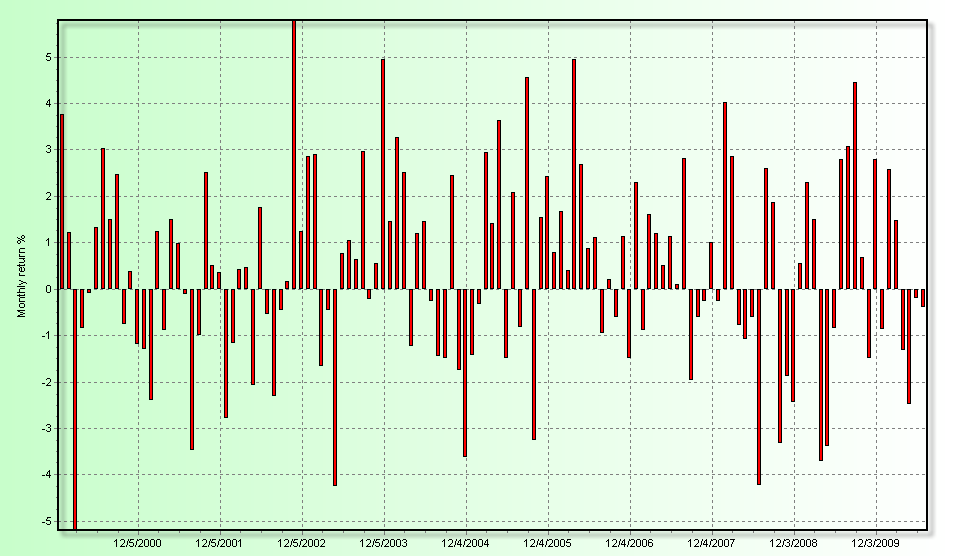
When we have data about the monthly percentage returns of a strategy during the past 9-11 years obtained through reliable simulations we can get a myriad of important information that allows us to gauge the probability of getting certain short term results. The graph above shows the monthly return chart for an Asirikuy system for the past 10 years. As you can see there are many profitable and unprofitable months and by taking the data from this chart and doing a basic statistical analysis over it we can obtain some vital information about the trading strategy.
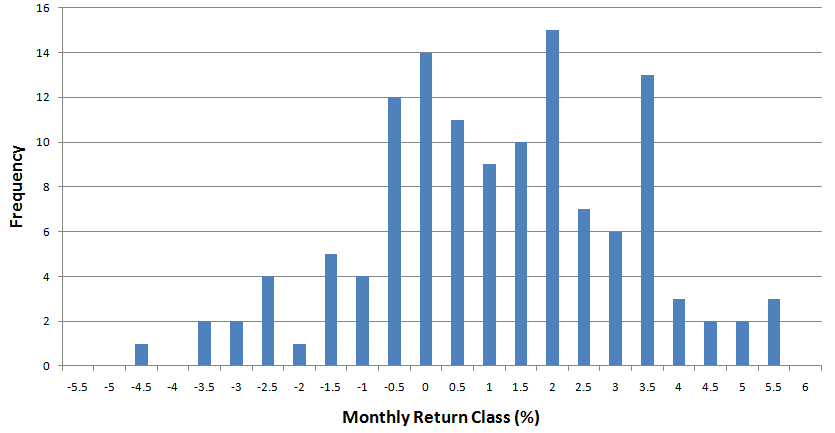
The above image shows you a frequency distribution of the previous data divided by classes (groups of months within a certain profit group, for example from 0% to 0.5%). Using this information we can analyze the distribution of monthly returns and get a myriad of information regarding short term results. For example by analyzing this data we can see that the probability to have a losing month for this system is 41% while the probability to have a winning month is 59%. If you have a profitable month the largest probability is that it will be between 0.5 and 2% while a losing month will most probably be between 0% and -0.5%. This means that whenever you have a losing month you won’t be surprised – there is a 41% chance ! – and you will know however that – in the long term – profitable months will be more numerous and more profitable than the average losing month.
The above monthly distribution also allows us to determine some key statistical measurements such as the skewness (how deviated the distribution is from being centered around 0%) and the kurtosis (how fat and spiked is the data when compared to a normal distribution). The above distribution – for example – has a skewness of 0.80 and a kurtosis 2.17 meaning that the distribution is centered around positive territory and it has “fatter tails” than a normal distribution. This two characteristics are important since they give us a measure of how probable it is to have a profitable month (skewness) and how probable it is too have a very profitable or a very unprofitable month (kurtosis). A distribution like the above which is centered around positive territory with fatter tails implies that in the short term we might expect positive results with a higher frequency but there is a significant probability to also have profitable or unprofitable months that deviate significantly from the average. This allows us to better understand short term results since a -5% losing month would not surprise us – as the kurtosis tells us it might happen – as well as a 7% profitable month.
Of course it might help you to learn some basic statistics before carrying out this analysis (the meaning of the above terms, what a normal distribution its, etc) but having this information will prove immensely useful when analyzing your short term trading results as they will allow you to remain centered and avoid greed (under rare very profitable short term conditions) or fear (under expected draw down conditions). Of course if you would like to learn more about this analysis and how it can easily be performed using the tools available within Asirikuy and a spreadsheet program please consider joining Asirikuy.com, a website filled with educational videos, trading systems, development and a sound, honest and transparent approach to automated trading in general . I hope you enjoyed this article ! :o)


Hi Daniel,
Great post, I think this is an issue which interests many of us. One question please: To what Asirikuy Risk Level do you refer when you say “-5% losing month” (or +7%)?
Thanks.
Hi Arnon,
Thank you very much for your comment :o) I am glad that you liked the post ! The system used as an example within the post was the same system included in the “monthly return analysis” video (explaining these terms and analysis in detail) within Asirikuy. Thanks again for your comment !
Best regards,
Daniel
[…] few months ago I wrote a post on this blog (here) about the distribution of monthly returns and how this analysis is important to understand how a […]