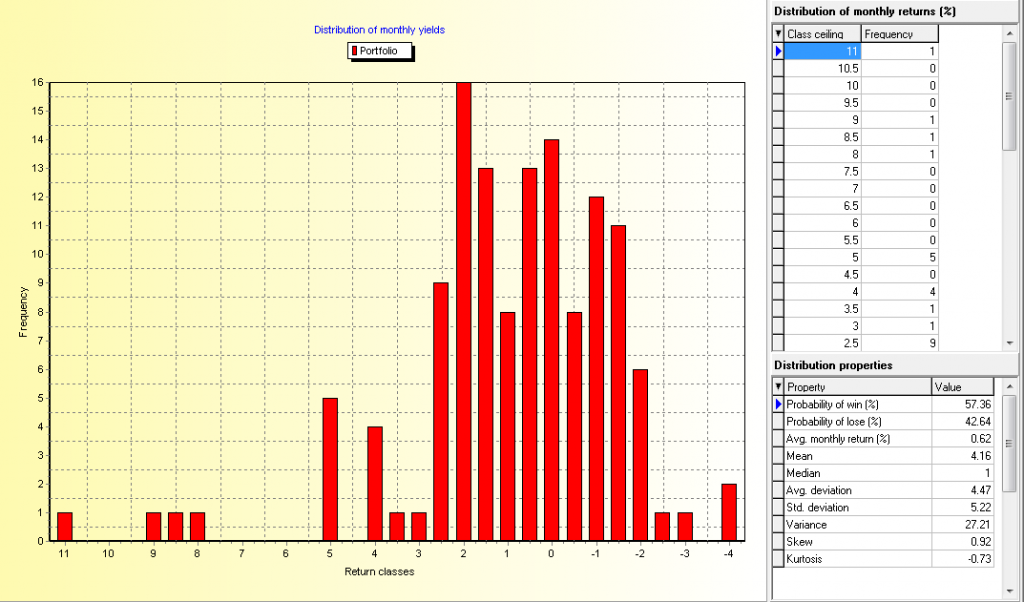
A few months ago I wrote a post on this blog (here) about the distribution of monthly returns and how this analysis is important to understand how a trading system works from a statistical perspective in the longer term. However up until now our analysis of Asirikuy systems using this analysis was limited due to the lack of an easy way in which we could get this data from the backtesting results of our strategies without an inconvenient process which involved manual calculation of classes in excel, arrangement of the data, etc. On today’s post I will be talking about the implementation of a monthly return analysis on our Asirikuy profit and draw down analysis tool and how it greatly helps us with the understanding of our trading strategies.
When analyzing the way in which a trading strategy works it becomes important to understand the way in which return behaves in the long term across short term time frames. For example it becomes important to know what the probability of having a profitable/losing month is and what the maximum and minimum expected profit/loss values actually are on a monthly basis. By diving the trading results of monthly returns across a 10-11 year backtest in different categories we are able to adequately get this important statistical information.
Previously within Asirikuy we used the monthly return data from our profit and draw down analysis tool coupled with the processing of this data through excel (or another spreadsheet program) to get this information. This involved the manual distribution of monthly returns amongst different classes followed by a frequency and other statistical analysis which was needed to come up with relevant distribution information such as skewness, kurtosis, averages, median values, etc.
–
Recently – with the great help of this tool’s wonderful coder (who is an Asirikuy member) – the complete implementation of monthly distribution analysys was added to our Asirikuy profit and draw down analysis program. This addition allows us to analyze the monthly returns of trading strategies very quickly, without the need to process the information outside the program, saving us a great amount of time and allowing us to easily do this for single systems, portfolios, etc. (note that the new updated version will be released tomorrow to Asirikuy members)
The analysis done by the tool also includes all relevant statistical information so data such as the kurtosis and skewness of the distribution of monthly returns – which are very important to evaluate a system’s characteristics – are easily determined by the program. The program also automatically divides the monthly return information into adequate classes, greatly simplifying the necessary effort and analysis when interpreting the results.
–
Although the distribution of monthly returns wasn’t very widely used within the Asirikuy community due to the difficulty of doing this analysis for a large amount of systems, the new implementation within our profit and draw down analysis tool makes this task much easier, allowing it to become a routine part of system analysis for all Asirikuy members.
The importance of this analysis should also never be underestimated since knowing how system results can turn out in the short term can be a great way of increasing a person’s confidence and ability to actually execute the system in the long term. For example knowing that a system may have a 70% probability to have a losing month will make the user aware that most months should be expected to be losers while only a few – very profitable months – will get the system out of draw down and into profit (such is the case for systems like Quimichi and Ayotl).
As you see our Asirikuy analysis tools are becoming a very sofisticated set of statistical analysis programs for the adequate determination of trading system characteristics. This addition of monthly return analysis to our analysis tool’s features is definitely a great enhancement which will allow us to get to know our systems in a much better way. If you would like to learn more about our tools and the examination of a system’s long term characteristics please consider joining Asirikuy.com, a website filled with educational videos, trading systems, development and a sound, honest and transparent approach towards automated trading in general . I hope you enjoyed this article ! :o)


