Those of you who are familiarized with my work will know that the Average True Range (ATR) indicator developed by Welles Wilder plays a very important role in my development of automated trading strategies as it is an extremely good tool to measure overall market volatility. The advantages of the ATR are many in that it is able to measure volatility taking into account market gaps and their relationship to high/low candle values. However it is true that the ATR is not the only indicator available to measure volatility and some other approaches with their own advantages/disadvantages against the ATR also exist. On today’s post I will take you on a journey to explore other alternatives to measure volatility beyond the analysis of the true range. Later on – within the indicator series of posts – we will most likely explore all the intricate aspects and possibilities within each one of these methods to measure volatility.
The first question we need to answer is : What is volatility ? Volatility is simply a characteristic of the market which is directly proportional to the amount of movement within a given instrument. There is no “standard measure” of volatility or “units of volatility” and the notion of how volatility is measured and interpreted is almost entirely up to the trader. We can understand measured volatility as any measurement taken of the total “walk” of the market, a measure of how much price moves within an instrument within a given period of time.
–
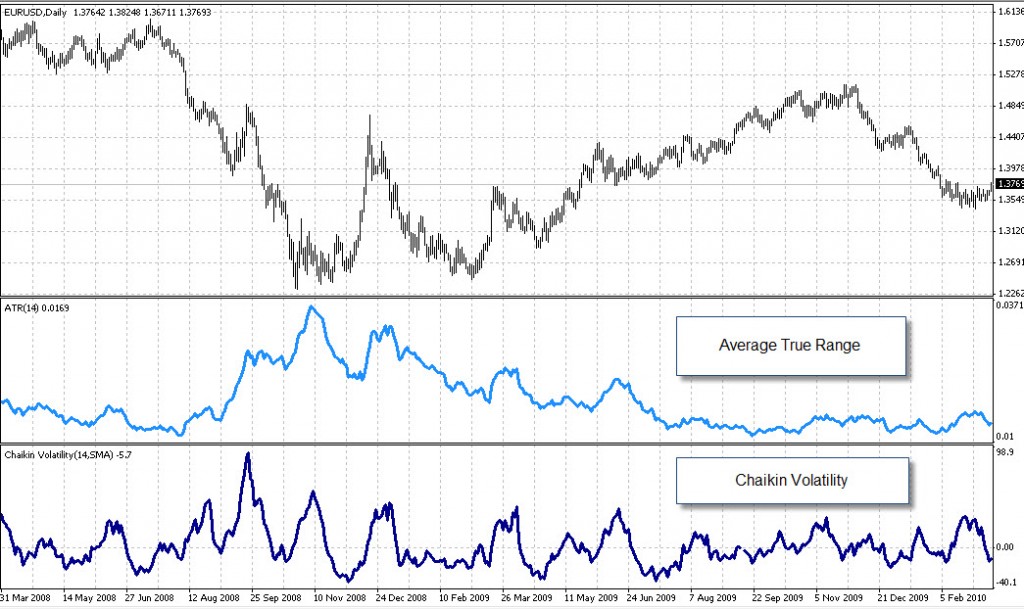
The most primitive form of volatility measurements takes into account only the range of a given instrument on a chart. The daily range indicator achieves this by informing us about high/low differences within any chart. By knowing the daily range of X candles and determining an average we can know how volatility varies within a given period. The only problem of the daily range approach is that many times instruments have gaps which also imply volatility are are not taken into account as they do not play a part in the high/low values of candles. This is where the ATR becomes better than the true range since it can take into account gaps effectively. A calculation of averaging based on this daily ranges is also known as Chaiking Volatility.
Chaiking Volatility = (EMA (H-L (i), 10) – EMA (H-L (i – 10), 10)) / EMA (H-L (i – 10), 10) * 100
Another interesting concept based on the “true range” is the volatility ratio which is simply a measure of the current “true range” divided by the ATR over the past X periods. This gives us a notion of when the market achieves breakouts as we get a very good idea of how volatility is changing relative to the past X periods. Although the volatility ratio indicator is merely a variant of the ATR it does provide more insight into volatility as we get a clearer view of “breakouts” as volatility surges get easily pin pointed. This concept was initially introduced by Jack Schwager on one of his books on technical analysis.
–
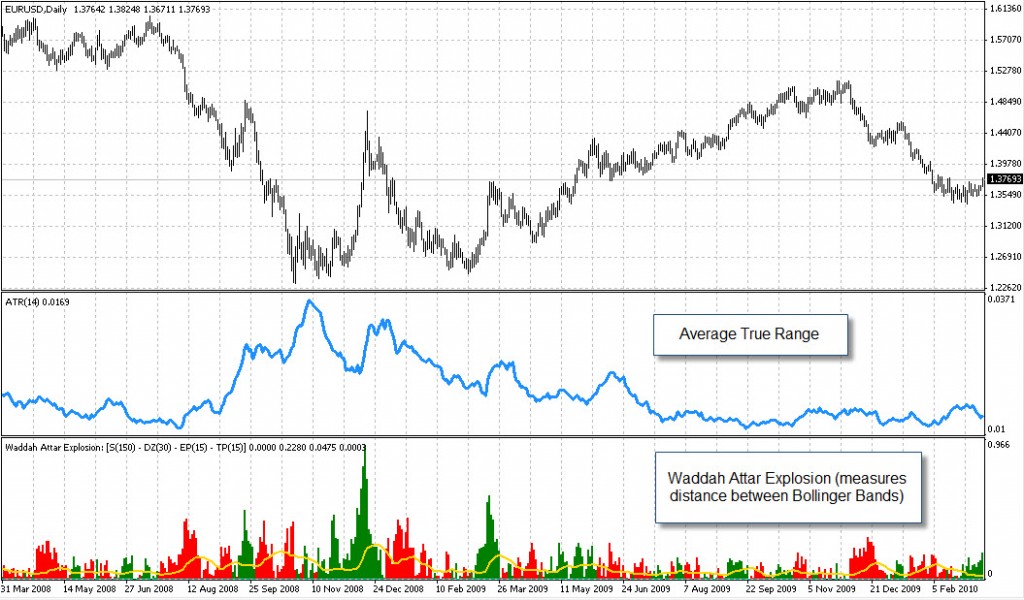
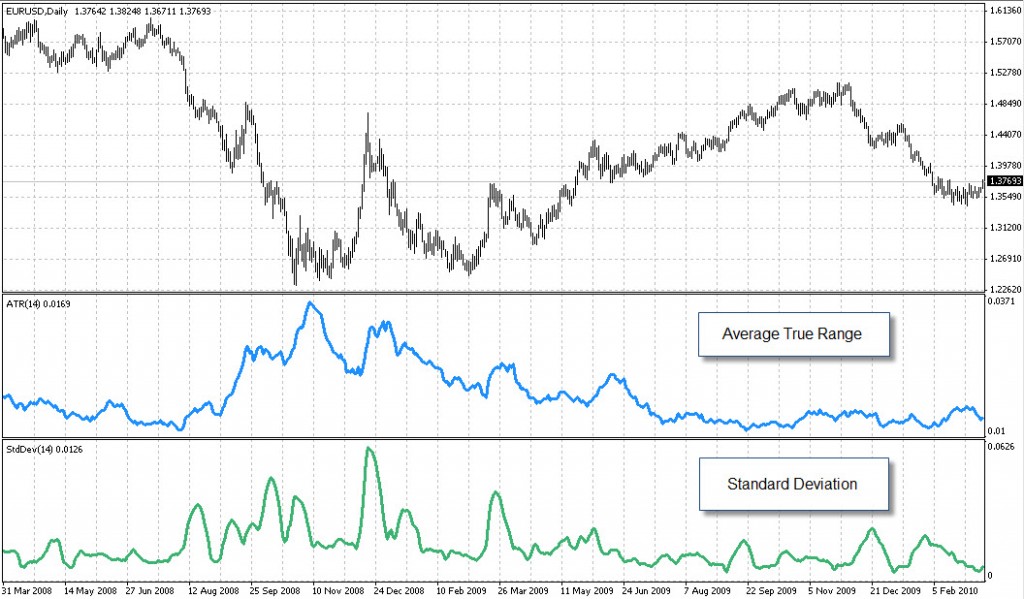
There are also other ways in which we can measure volatility which have absolutely nothing to do with “ranges” but with other statistical aspects of candlestick charts. Indicators that measure the distance between the Bollinger Bands can serve as volatility indicators as they show us how the standard deviation of a given currency pair changes over time. Using a mere standard deviation indicator will also have similar results. Standard deviation is a valid way to measure volatility because the standard deviation of an instrument increases as volatility rises due to the fact that price tends to deviate more strongly from its average value.
As you can see there are many ways in which volatility can be effectively measured. The ATR is the one I like the most due to its wide use and its ability to take into account gaps. However other criteria based on exponential or simple averaging of daily ranges or the use of the standard deviation can also be used as weapons within our trading arsenal. Without a doubt successful adaptive systems can be developed with any of these different criteria and some may have advantages over the true range depening on the strategy being evaluated. So next time you consider an adaptive criteria for your systems (or a volatility indicator to trigger a certain entry/exit mechanism) please remember that volatility can be measured in many ways, besides the commonly used ATR.
–
If you would like to learn more about my work in automated trading and how you too can develop your own adaptive trading strategies based on volatility criteria please consider joining Asirikuy.com, a website filled with educational videos, trading systems, development and a sound, honest and transparent approach to automated trading in general . I hope you enjoyed this article ! :o)


that’s an excellent article on Volatility, for the most part some of these indicators are very less talked about.