Most traders who explore technical analysis for long enough will eventually run into the work of Dr.Alexander Elder and his development of a trading technique based on the use of moving averages and the difference of high and low values with them. His indicator sets are included on most modern technical analysis software as the bull power and bear power indicators. These graphic displays of Elder’s trading system, give us a novel perspective into the way in which the market moves allowing us to see opportunities and information which would be harder to see otherwise. Within this post I will talk about the Elder Ray Index, which is simply the use of three combined indicators – two of them developed by Dr.Elder – to trade the Forex market.
The three indicators used within the Elder Index are mainly the Bull Power, Bear Power and a 13 period exponential moving average. This trading technique was developed to trade the daily time frames and therefore my analysis will be constrained to this original application although applications on other time frames might also be viable. I will first talk to you about the mathematical definition of the power indicators and I will then give you some example and ideas for their usage.
–
The Bull and Bear Power indicators are merely a histogram display of some very simple mathematical calculations. The Bull Power indicator displays the difference between the high of a bar and the value of the 13 period exponential moving average while the Bear Power indicator shows the differences between the low and this same average. The idea of these indicators is to give you a hint of which faction – buyers or sellers – is able to pull price further away from the value which is regarded as a consensus (the average). A very low value of the Bear Index – for example – signals that on that bar sellers were able to push price well below the 13 period EMA.
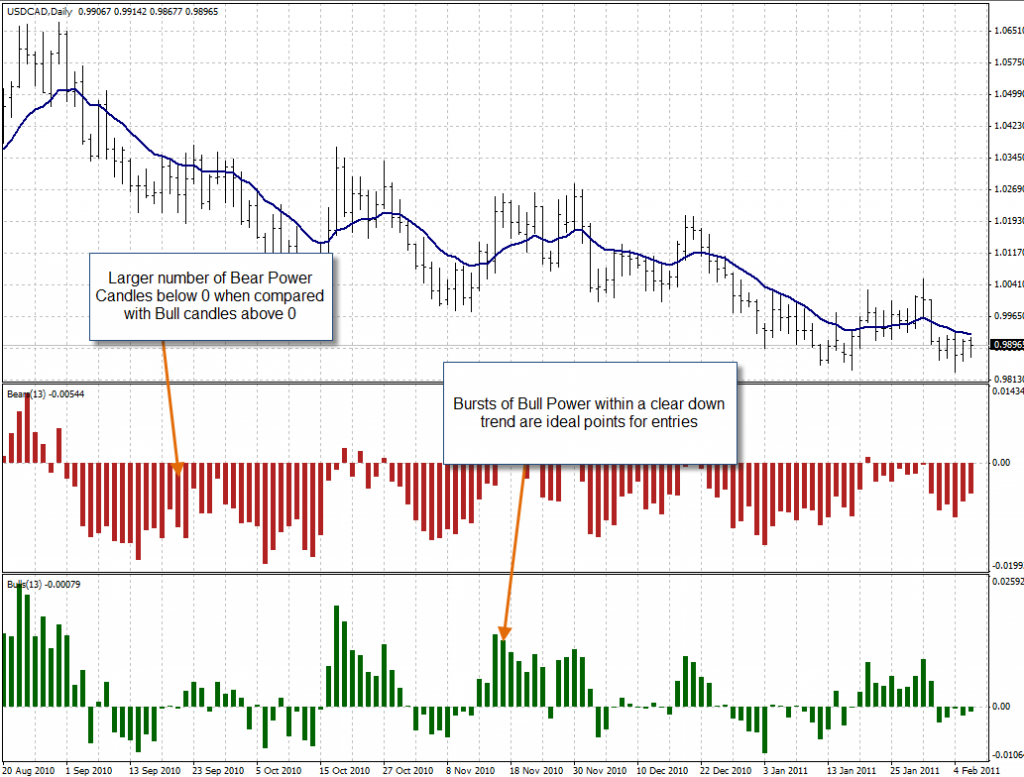
There are certainly innumerable and very useful ways to use the information provided by the Elder Ray Index. The first and most important – at least in my opinion – is its ability to clearly show trending movements and retracement. Since within a trending movement a moving average tends to move in a certain direction due to momentarily but constant “pushes” into one direction against another, comparing the number of bars above and below zero for both Power indicators can give you an idea about the trend direction and the number of retracements. The above example on the USD/CAD perfectly shows this concept as a clear down trend is characterized by a larger number of Bear Power bars below zero and a lesser number of Bull Power bars above zero. It is clear then that these “pushes” against the consensus creates the trending movement.
Once you establish trending movement direction it becomes very clear how this indicator can be used to enter trends on retracements. If you know that the global long term trend is headed towards the short side and you see a strong Bull Power movement then it becomes clear that a high probability of that movement being merely a short term retracement exists. Certainly – as all trading techniques – any system devised with the Elder Ray index won’t be perfect but it allows you to evaluate trends in a way which is very difficult with other indicators which do not provide such short term and clear market information (especially when viewing the long term picture).
–
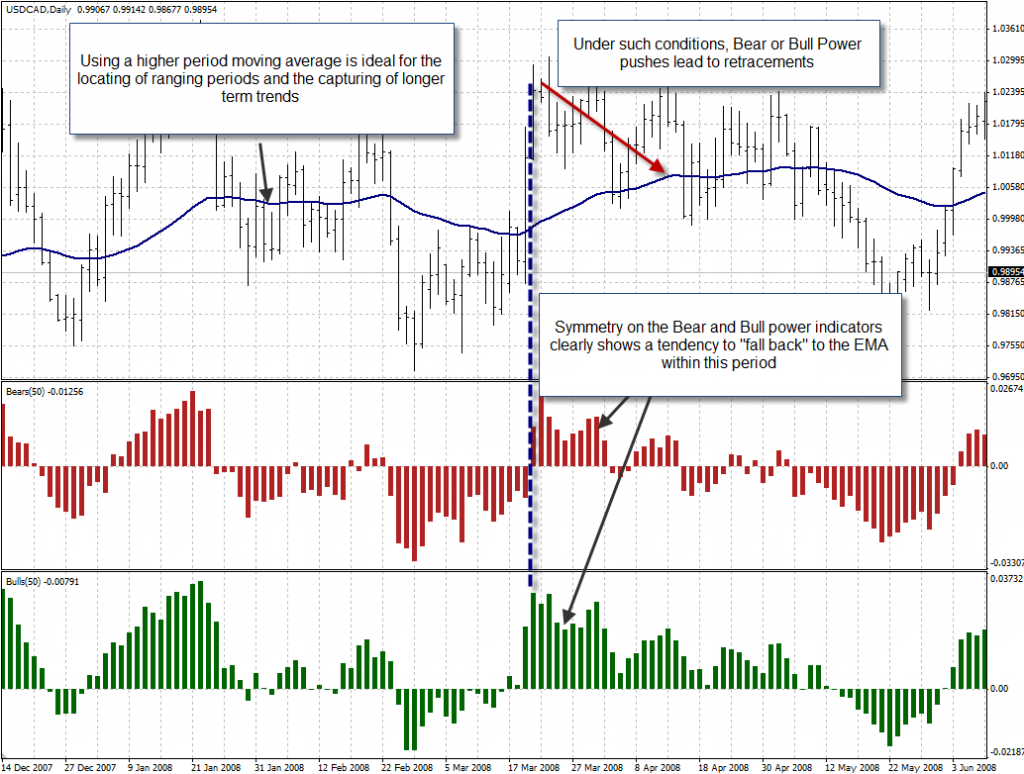
Besides these trend following movements – which are what seems to be the highest probability trades provided by the Index – you can also determine that a market has been ranging for a certain period and enter retracements in both directions as deviations above or below the EMA are bound to reverse to the consensus value. In short, the Elder Ray Index is all about judging the long term picture through an analysis of the behavior of the Bull and Bear Power Index and then take decision based on what seems more probable under such deduced conditions. Certainly there is a market exposure to any trading technique designed with this in mind but you can easily arrive at strategies with positive mathematical expectancy values by using entries and exits based on following trends using an analysis of the Elder Ray Index.
As always, the power of any analysis technique and its potential to become a profitable system rest on the ability of the trader to adequately interpret the mathematical calculations behind the indicators and use them in a way which is truly meaningful and which tackles a sound market inefficiency. The Elder Ray index is a powerful set of trading tools which allows us to gauge trader indecision around the market consensus of value for a given instrument. Using these tools algorithmic strategies to follow trends can be devised and trend direction – as well as retracements – can be easily determined with a set of trading tools centered around a simple idea.
Other ideas derived from the Elder Index are also very well possible. For example, you could calculate differences with different moving averages or you could even normalize the elder index based on the maximum high/low differences with the EMA in order to have an indicator which can be used in an easier fashion and which might even be more suited to the development of algorithmic strategies since meaningful coarse optimizations can be done with normalized indicators. Especially when there is the intention to use the indicators amongst different currency pairs.
Long story short, the Elder Index is another great tool on the technical analyst’s arsenal and a great starting point for the creation of algorithmic trading strategies. The idea behind the Elder Index (especially the Power indicators) can be used as a novel and useful interpretation of overall price action and the way traders react to it. If you would like to learn more about work in algorithmic trading and how you too can learn to create likely long term profitable system based on sound trading tactics please consider joining Asirikuy.com, a website filled with educational videos, trading systems, development and a sound, honest and transparent approach towards automated trading in general . I hope you enjoyed this article ! :o)


[…] of what most people know as the “Elder Ray Index”. This trading tool has been described previously on my “indicator series” of posts where I did an in-depth discussion of what the […]