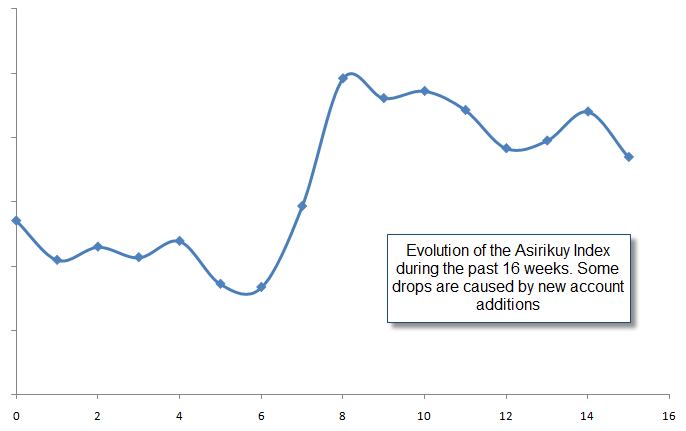
Many months ago – back in early 2010 – I wrote a post about ways in which performance could be measured within Asirikuy. The idea I came up with back then – which sounded like a good way to monitor overall performance across many accounts – is what I know call the Asirikuy Index (AI). You can read more about this idea on this post. Nonetheless after some experimentation last year I decided to put the concept “on hold” and only started to apply it earlier this year when I began to collect spreadsheets with all Asirikuy system weekly results for the new format of our weekly newsletter. On today’s post I want to share with you some of the advantages and problems of this index approach and how it can give us some idea of how things are evolving within Asirikuy.
The problem faced last year – which has only become bigger – lies on the large number of real live accounts within Asirikuy. With almost 70 different live accounts trading a myriad of systems it becomes interesting to come up with some sort of measurement to tell us how accounts are evolving from a more “global” perspective. The idea I had last year was to simply “add up” the results of all the different accounts to give us an idea of what the overall “gain or loss” as a percentage of initial equity was for Asirikuy in general. However – after consulting with a few members – it seems that an average (instead of a mere addition) was a much more favored approach since it gave a better perspective on a “per account” instead of an “all account” basis.
–
The main problem with both of these approaches is mainly related to the way in which they change over time and how new account additions affect the calculation. The addition approach has the advantage of giving us a more robust perspective since account additions do not affect the results it in a very important way (new accounts just add 0%) while the main problem is the lack of normalization and therefore the possible exponential increase caused by large account numbers. The averaging approach has the exact opposite problem, results are always normalized but new account additions cause big shifts since they cause the averaging of additional 0% values which can significantly diminish the value of the index.
In the end the averaging approach seems to make more sense – even if account additions impose a penalty – because we are effectively looking at the average all-time return per account based on a very large number of accounts with very different trading times (some more than a year, some less than a week). New accounts do cause the index value to go lower but this makes sense since those new account additions imply a redistribution of the average amongst a higher number of accounts. It is analogous to calculating the average fishing frequency of a fleet with a new boat, the new boat will make the overall average drop, but this is acceptable if what you want to consider is simply the average.
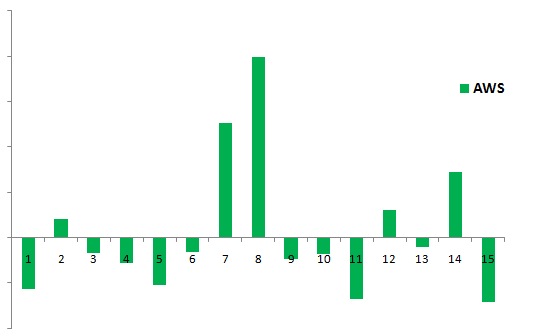
It is important to consider however that any type of weighting of the accounts is inappropriate since we want to have a clear gain/loss perspective which is distorted by taking into account other criteria (such as account trading duration). The averaging approach offers then a clear view of how things are evolving although drops may happen due to new accounts additions due to the redistribution of the average. Perhaps the most useful criteria is NOT the overall index value but the way in which the index changes through time as each weeks index shift always considers the same number of accounts. The Asirikuy Weekly Shift (AWS) could therefore be a more interesting value when considering the evaluation of weekly performance. The average of the AWS could therefore be considered a better proxy of overall performance than the simple evaluation of the AI.
–
I have been collecting full weekly performance data for all accounts during the past 15 weeks and we can already see what we would expect to be the way in which Asirikuy systems perform as a “super portfolio”, we see periods of very high profit taking which are followed by periods of small draw down with small ups and downs caused by weekly variability. Most importantly, the average of the AWS during this whole period has been positive, implying that -overall- the weekly change of Asirikuy as a whole has been positive.
If you would like to learn more about my work in automated trading and how you too can get a true education in automated trading please consider joining Asirikuy.com, a website filled with educational videos, trading systems, development and a sound, honest and transparent approach towards automated trading in general . I hope you enjoyed this article ! :o)


