You look into your trading account and things seem to be extremely predictable. A careful statistical analysis of your portfolio quickly reveals that there is a 90% probability that a winning trade will be followed by a winning trade and a losing trade by another losing trade – a light bulb has just lit up above your head – what if I use this impressive correlation to my advantage? What if I simply cut lot sizes by half after the first change from a profitable to a losing streak and double lot sizes on the first trade of the opposite case? You then start to think that the statistics are there – clear as fresh spring water – and there is certainly no reason why you shouldn’t implement this idea. I could have made a ton more money — you naively think.
I have often been amazed at how people misinterpret and improperly analyze the statistical relationship between the different trading results within a trading system or portfolio. Through the past year I have received many emails with stories like the above in which surprising correlations seem to arise which prompt trades to believe that they should in fact change the way their strategy is working in order to take advantage of these seemingly powerful statistical findings. After all, why wouldn’t you want to take advantage of something which appear to be so evident ? I will now walk you through some of the important aspects of correlation analysis and why it is tremendously important to analyze cause, effect and whether or not these relationships can really be exploited to improve your strategy’s money management.
–
–
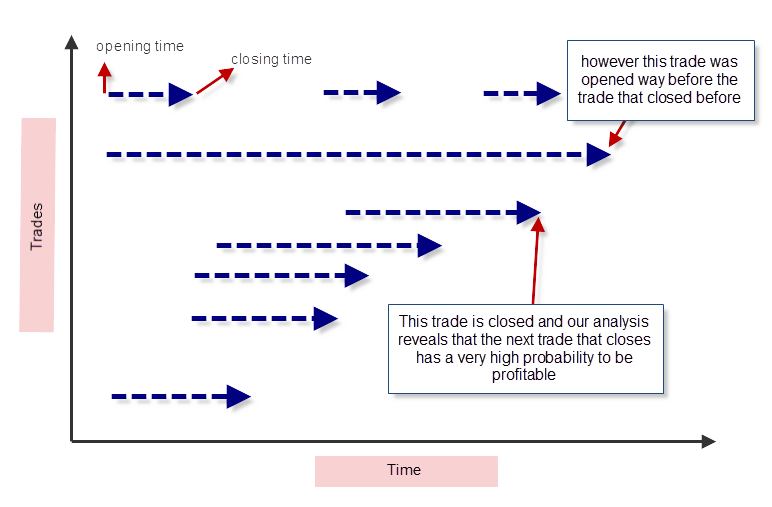
First of all let us build an understanding of how the trading results on a portfolio or systems are actually generated and why some conclusions derived from trade correlations can be completely invalid. As you know your account’s history is simply a collection of all the positions that have been exit/entered, a very simplified version of what actually goes on inside your trading account. The above image – in which each arrow represents a trade – shows you how things really materialize inside your trading account, especially if your trading account can have a number of open positions larger than one at any given time. The most important thing you need to note is that there is a very complex timing relationship between positions which is not properly described by a simple statement.
Why is this so important? Generally system portfolios reveal to have very strong statistical correlations when you look at the trading history which might encourage you to assume that these correlations can be exploited through modifications of your strategy’s money management. However in reality it turns out that knowledge of the future would be needed to exploit these correlations. For example many portfolios seem to have a tremendously high probability to have consecutive profitable trades but this is the case in fact because when a position reaches a profit the positions that will most likely also reach profitable outcomes have already been opened for a long time. You are therefore unable to intervene because your knowledge of correlations did not take into account the precise timing relationship between the different positions and their outcomes.
You should therefore not be tricked into believing such correlations can yield increases in profitability when in reality they are simply untradable. Many profitable strategies and portfolios which can hold several positions opened at a time generally exhibit one or more types of seemingly easily exploitable correlations which in the end turn out to be impossible to exploit due to the relationship between position opening times and the time where you know the outcome which has predictive power. As in the above example it usually happens that you know something with a high degree of certainty once something happens but when that happens the consequence is already almost entirely fulfilled (too late for you to intervene). Obviously if the finding of correlation within trading strategies and systems was so easy to find it would be terribly easy to greatly increase the potential of systems through simple manipulations of their money management.
–
–
Does this mean that there is no correlation between the results of systems/portfolios that can be exploited to improve money management ? No – it certainly doesn’t – but it means that the correlations need to be examined through a much more in-depth analysis which requires a careful analysis of the open/close time relationships of all the positions taken within the account. Simple analysis based only on the historical statements (like the Z-score) are very gross over-simplifications that generally lead to useless conclusions (as highlighted above). If you want to analyze if there is some kind of “money management edge” within the results of your trading strategy a much more elaborate analysis needs to be taken into account in which you only take into account how the outcomes of positions which are yet to be opened are evaluated to past outcomes. When this is done it is often found that there are no useful linear correlations.
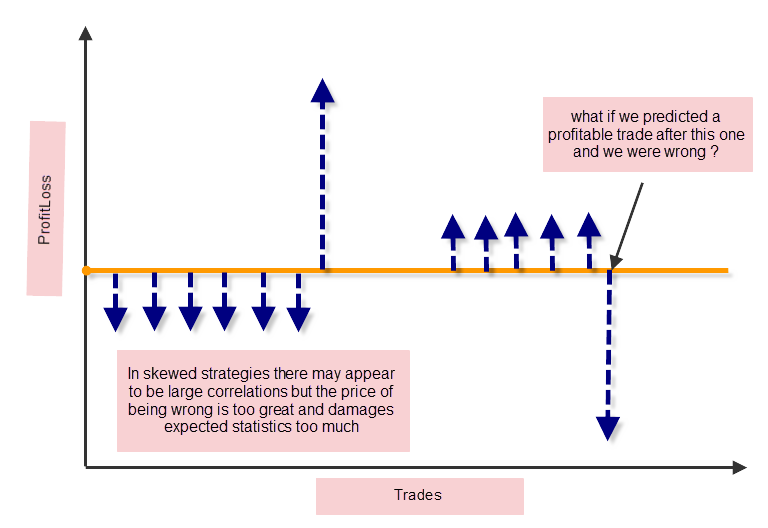
Another important thing is to consider the actual consequences of a correlation-related modification being wrong and how your strategy manages risk. For example if you have a strategy that has a 10 pip take profit and a 100 pip stop loss then you can easily assume that trading twice more capital after a loss will carry only a small possibility of incurring an additional losing trade but reality is that the risk you’re incurring if your prediction is wrong is too great as you will be losing an extremely large amount of money. Correlations of heavily skewed strategies do NOT work because they distort the strategy very heavily when they are wrong.
The same principle applies to a strategy which is skewed towards the profitable side, if your profit depends on one positions out of every 20 that makes 20% profit but most of your trades are losers then it becomes a bad idea to modify trades (reduce lot sizes because after a loss a losing trade is bound to come) because when you’re wrong you will lose a very large size of your expected profit. If a strategy has a heavy different between its losing and profitable sides then it becomes terribly difficult to create money management solutions that do not heavily distort expected statistics.
The above mentioned issues however do not imply that there is no possible way to exploit trade correlations but merely that relationships are quite complex and that the actual mechanisms in which money management is modified need to carry a measurable risk which does not put the account at more overall risk than the original strategy. My way to tackle this issue – through the use of Neural Networks – has already yielded some meaningful results and hopefully in the not-so-distant future I will be able to release a generic Neural Network implementation which will be able to dynamically improve the results of a large majority of our Asirikuy strategies through the simple use of money management modifications.
If you would like to learn more about my work in automated trading and how you too can learn more about system evaluation and design through hard work and understanding please consider joining Asirikuy.com, a website filled with educational videos, trading systems, development and a sound, honest and transparent approach towards automated trading in general . I hope you enjoyed this article ! :o)


Hi Daniel,
great to have another post from you here! :)
While in consequence I follow your argumentation, I would formulate the question a little bit more theoretical: in a stochastical process, can you exploit the fact, that winning or loosing streaks occur? The short answer simply is: NO. You can only exploit that one event is more probable than another and streaks are just an artefact of probability.
Best regards,
Fd
Hi Fd,
Thank you for your comment :o) I do agree with what you say. If there is a way to increase the profitability of strategies through modifications of their money management it arises from much more complex patterns. As I have said before I have found some success with neural networks in making successful predictions (long term statistical edge for the prediction of future outcomes) but certainly a ton more testing is needed before anything conclusive can be said. Thanks again for posting.
Best Regards,
Daniel