The need for system portfolios in trading is a real no-brainer. The efficacy of an edge can deteriorate with time and therefore the use of different systems that hedge and compliment each other seems to be necessary to increase profitability and reduce risk. However the problem with portfolio building comes from the fact that it’s always done with hind-sight. Any combination of strategies that are historically profitable will tend to give better results than a single system and the more you pile up strategies the better the results you will get. This means that you’re encouraged to maximise your margin usage because you will almost always get an advantage in historical testing from doing so. On today’s post we will be discussing some of the real life issues that arise from these problems and how we can arrive at potentially better portfolios by building portfolios based on moving window correlation. The concept of moving correlations allows us to see how the relationship between strategies changes with time and whether any observations are simply fortuitous or reflective of a strategy’s nature.
What is the problem with the creation of portfolios ? Let us suppose you have two systems, A and B. When you simulate a run of A+B you get much better results than when you trade A or B on their own but you are unsure if you should put them together for live trading. However you decide to go forward and trade them live but suddenly you hit a drawdown period where both A and B tank and you are left with a reaching of your statistically determined worst case scenario, without knowing what went wrong. Why was your decision to put A and B together wrong if your back-testing results show you that it made perfect sense, the results were in fact better – and the risk was supposedly less – than when you traded them apart! In order to understand why things went wrong and why the choice to run A+B together wasn’t justified we first need to understand what makes systems give better results when simulated as a portfolio under historical testing.
–
–
If A and B are both profitable during your back-testing results, then it is obvious that the profits of A and B will be additive since both of them are – in the end – going to generate profits. However the drawdown periods from A and B will most likely not perfectly match and therefore you will see that your maximum drawdown periods will – with a very high probability – drop to a smaller value. So you have added a lot of compounding power (additive profits) but your drawdown has dropped due to the misalignment of drawdown periods. Results for portfolios of historically profitable systems will always be better than the individual systems due to the above reasons. You need to look for something beyond the simple improvement in trading statistics to be able to judge if A and B should belong together or if they should stay apart. But what makes this difference?
One possible answer: study system correlations. Correlations measure the way in which the results of a strategy are associated with the results of another, whether a 2% profit on system A is likely to cause a 2% profit/loss on system B. If system A makes 1% and system B always also makes 1% then the correlation coefficient between the two is 1 while if the opposite happens, A makes 1% and B loses 1%, then the correlation coefficient is -1. However you shouldn’t study the correlations of system results as a whole but you should calculate the moving window correlation of some return figure (correlation for the past X monthly returns) and see how it evolves through a long term (10+ year test). This will give you an idea of how stable the relationship between the strategies is and therefore how likely it might be in the future for the strategies to correlate and drag you into a deep drawdown. If your systems are always negatively correlated then there is a big chance that there is a causal link that prevents drawdown alignment and therefore it would be a safer bet to trade A+B. Note that correlations between systems will never be negative “all the time” because they sometimes align in times of profit! It is also important to see when positive correlations have happened (whether they align with loses or profits).
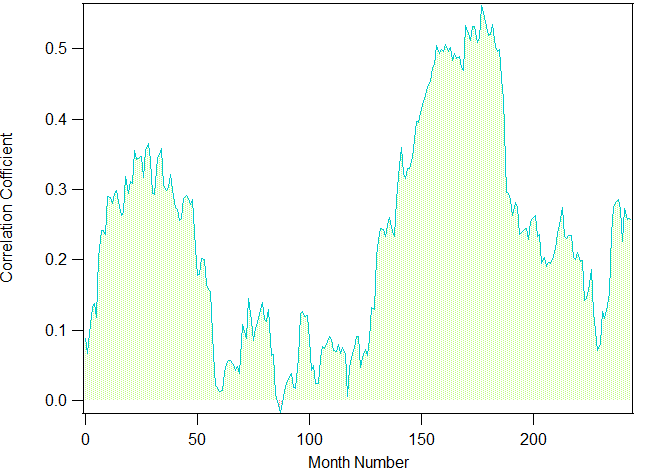
So what should you look for? The images in this post show you several examples of system correlations. In all cases A+B give better results than either A or B traded alone but in some cases it is clear that the correlations imply that the systems should not be traded together. The first image shows the 48 moving monthly return Pearson correlation coefficient for two trend following strategies on the EUR/USD, since both strategies tackle similar market phenomena they show a very high positive correlation through the entire test (they only have a two month period of slightly negative correlation!). Although the results of A+B are better than A or B we should not trade these two systems together because it is obvious that they have a tendency to work in the same way and therefore the probability that they will align and kill the account when they fail is quite high. It is evident that systems that are designed with poor regard to correlation tend to have worse robustness because the strategies are hard-wired to tackle similar market phenomena.
–
–
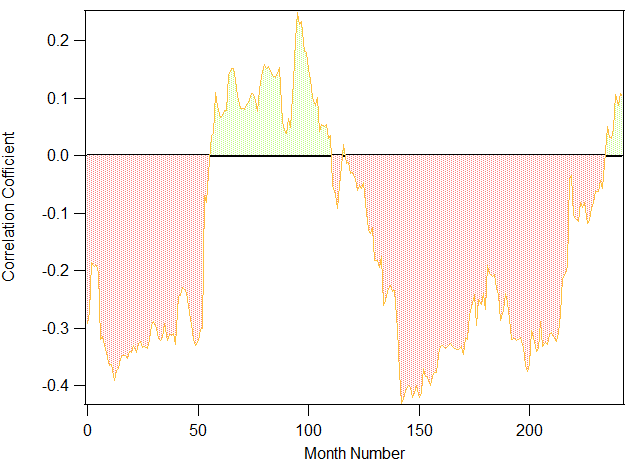
Take a look at the second image I have posted. This image shows you a counter-trending strategy coupled with a trend-following strategy on the EUR/USD. The strategies have a much better hedging relationship and you can see that correlations are largely negative through a very big portion of the test. The positive portions you see correspond to profitable periods and – even then – the magnitude of these correlations is quite small (less than 0.2). You could therefore infer that the probability that these two systems will align within a significant drawdown phase is much smaller because the very nature of the strategies suggests that they trade in different ways that generate return structures that tend to be negatively correlated. This obviously doesn’t mean that the systems cannot become heavily and positively correlated in the future but it does mean that the chance of this happening becomes much less significant. The idea here is to pair strategies that are fundamentally different so that “trading in the same way” becomes much harder between them.
It is also worth noting that the Pearson correlation coefficient is not very robust to outliers (assumes a normal distribution) and therefore it’s not the best idea to use the simple monthly returns to calculate it. It is therefore useful to use variants of the monthly return that can be treated via logarithmic transformations (as Fd has suggested within our community) to generate normal distributions. When working with the regular monthly return (non-normal) the Spearman correlation coefficient might be more accurate (as it is more robust to outliers and makes no assumption about normality).
Last but not least, I would like to thank Fabio – an Asirikuy member – who pointed me in the direction of some material that suggested the use of correlation windows as a tool to enhance the building of trading portfolios (so this is definitely not a new thing). This is certainly a useful tool that makes the building of portfolios that are “very likely to fail” much less likely. Of course, if you would like to learn more about trading systems and portfolio building please consider joining Asirikuy.com, a website filled with educational videos, trading systems, development and a sound, honest and transparent approach towards automated trading in general . I hope you enjoyed this article ! :o)


[…] forex trade – Google Blog Search Designing Forex Trading System Portfolios: Looking at Moving … Designing Forex Trading System Portfolios: Looking at Moving System Correlations. April 25th, 2013 No Comments. The need for system portfolios in trading is a real no-brainer. The efficacy of an edge can deteriorate with time and therefore … more info… […]
Hi Daniel,
you’ve already mentioned a few problems with the correlation coefficient (outliers, non-normality). I would like to add that both correlation plots are showing rather low, non-constant and widely varying correlation, which results in a lot of uncertainty when trying to predict what the correlation will be in future. Thus doubting a bit if this method should be chosen.
If be build a portfolio consisting of several strategies on a single instrument, I think it could be more robust to estimate the probability that 2 strategies are in the market at the same time and in the same direction. Ideally I would look for strategies that do not have a significant overlap being in the market.
Best regards,
Fd
Hi Fd,
Thank you for your post :o) Yes, you are indeed correct in that the correlations – in the above examples – are both non-constant and widely varying. I would want to have much more stable negative correlations before I would base portfolio design on this. However this does point out similar systems are much more correlated that systems that are designed to use opposing tactics. For example in the first case you can see that correlations are basically always positive while in the second case they are not. Granted that variations are significant but if you asked me to choose from the above two examples I would always choose the second over the first.
About the overlap, this is also a good idea for some systems but it might have some problems if holding times are very different. For example a strategy with an average holding time of 2 weeks might overlap considerably with a strategy that has a holding time of only 2 days so looking for two systems that do not overlap will rule out strategies that might be complimentary because they are tackling different ranges of movements (here one is looking to profit from a few hours while the other is looking for a few days). I think correlations over normalized data are a good thing, provided that we can find systems that are much more constantly correlated (meaning we have less variations in the correlations). Thanks again for your comment :o)
Best Regards,
Daniel
Wow Daniel,
now you make me really scared of such a series of advertisements! LOL!
Let’s digest together the material within Asirikuy!
F
Hi Fabio,
Thank you for your comment :o) No reason to get scared! Obviously we’ll continue to discuss everything within Asirikuy,
Best regards,
Daniel
Hi Daniel,
I sent you an email yesterday for subscribe to your program Asirikuy.com. I used /// email address removed ///. I’m waiting for your response. Can you have a look at it. Thanks.
Red
Hi Red,
Thank you for your post and interest in Asirikuy :o) I didn’t receive your email (probably blocked by my spam filter). You can join Asirikuy by using the paypal link on the asirikuy website joining page (http://asirikuy.com/join.htm). Once you join you will receive your login information within 24 hours. Thanks again for posting,
Best Regards,
Daniel
[…] the past I’ve written some posts about system correlations and how measuring the historical correlation between trading strategies […]