It is no mystery that current market conditions in the Forex market have become more difficult in average for algorithmic traders during the past year. Several systems – particularly several trading the lower time frames – have had problems dealing with market conditions since about June 2013. For many it has been a mystery why such systems failed and the question of whether these conditions are transitory or “here to stay” is of a fundamental importance. Today I want to go through some information from historical charts to see what type of conditions we’re currently going through, whether these conditions have appeared in the past and whether or not they are here to stay. We will take a look into two key market components – directionality and volatility – to characterize current market conditions and compare current events with those available within our historical accounts. For this analysis I will be using daily and hourly Forex data for the DEM/USD|EUR/USD from 1986 to January 2014.
–

–
How do we characterize current market conditions? There are mainly two aspects of the market that we can use to do this, one of them is how much the market moves (volatility) and the second is where it moves (directionality). Any set of market conditions can be characterized by a given degree of volatility and directionality across its different time frame components. We can have any combination of volatility and directionality. For example we can have a highly volatile directional market, we can have a highly directional, low volatility market, a high volatility, low directionality market or we can have a low volatility, low directionality market. In essence any set of market conditions will fit somewhere between the above definitions. But how do we characterize volatility and directionality? This is in general a difficult question and there is no perfect answer for it. Within this post I will be using the ATR (Average True Range) indicator to characterize volatility and the RSI (Relative Strength Index) to characterize directionality.
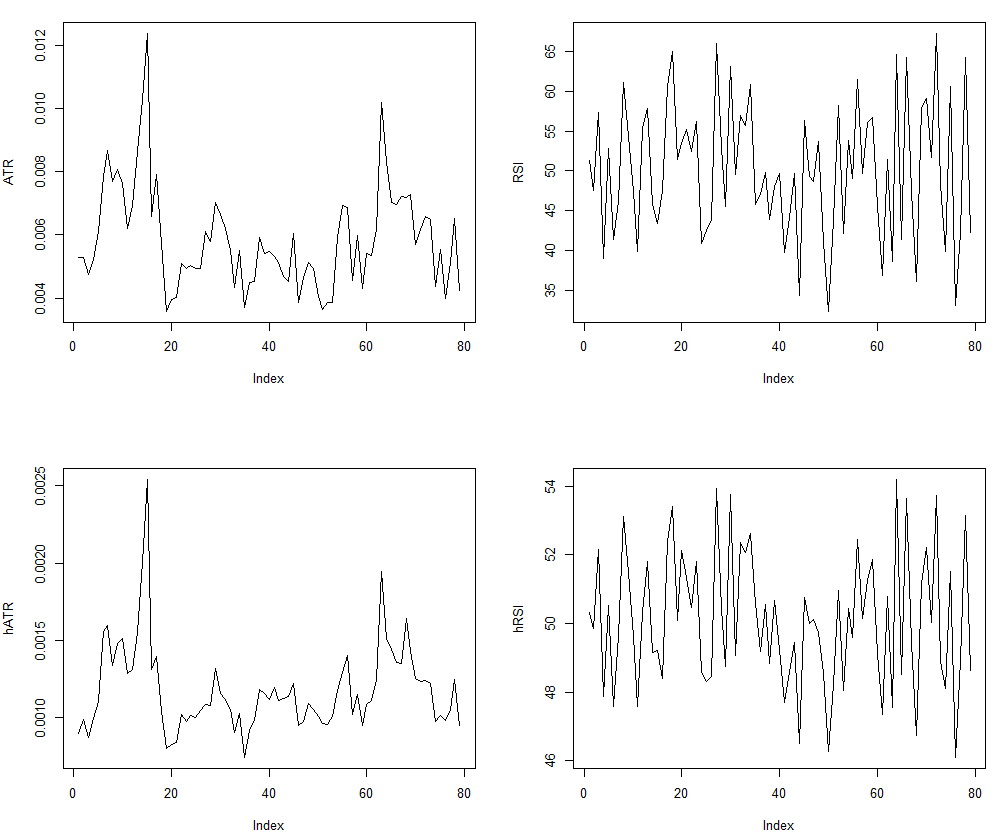
The first thing I did to characterize broad market conditions is to look at the daily charts and their historical evolution. As you can see right now we are facing some low volatility market conditions (ATR near record lows) while the RSI is also near its mid-point (low directionality). However it is evident from looking at the charts that in the past the market has also faced such low volatility market conditions. It is also interesting to note that previous periods of low volatility also saw low directionality in several cases (particularly during 1996) and such periods were also difficult for systems that faced deep drawdowns in 2012-2013 market conditions. Current market conditions therefore don’t look like anything “new” so it is puzzling therefore why systems that survived what looks like historically similar periods would have failed so bluntly under current market conditions.
–
–
In order to find the answer to the above question I decided to look at things into a bit more detail. Judging market conditions by the daily ATR/RSI values is definitely over-simplistic as the success/failure of most lower time frame systems does not depend on the character of the daily structure but more on the character of the lower time frames. For this reason I decided to calculate the average ATR/RSI values for each trimester on the daily and one hour time frames, in order to see how increases/decreases in daily volatility pair up with hourly volatility. Not surprisingly, there is a high correlation between the hourly and daily average trimester values. This points to the fact that most of the time a decrease in overall daily ranges happens due to a proportional decrease in the hourly ranges and not due to a decrease in directionality. This means that it’s not that price is getting trapped into smaller ranges with volatile lower time frames that simply don’t go anywhere but that the overall extent of price movements is dampened.
In the case of the RSI we see a similar phenomena, damping of the daily trends happens due to a similar dampening of trends on the lower time frames. However the RSI has a very interesting characteristic which is that the highest-to-lowest range has been expanding during the past several years, particularly after the financial crisis. The time between peaks has also become narrower, implying that there is tendency for faster reversals on both the lower and higher time frames. While reversals before 2013 took longer to happen they now happen faster than before and to wider extremes. This may explain in part why lower time frame systems based on momentum have had problems, they are unable to adapt to very fast changes in directionality across low and high time frames.
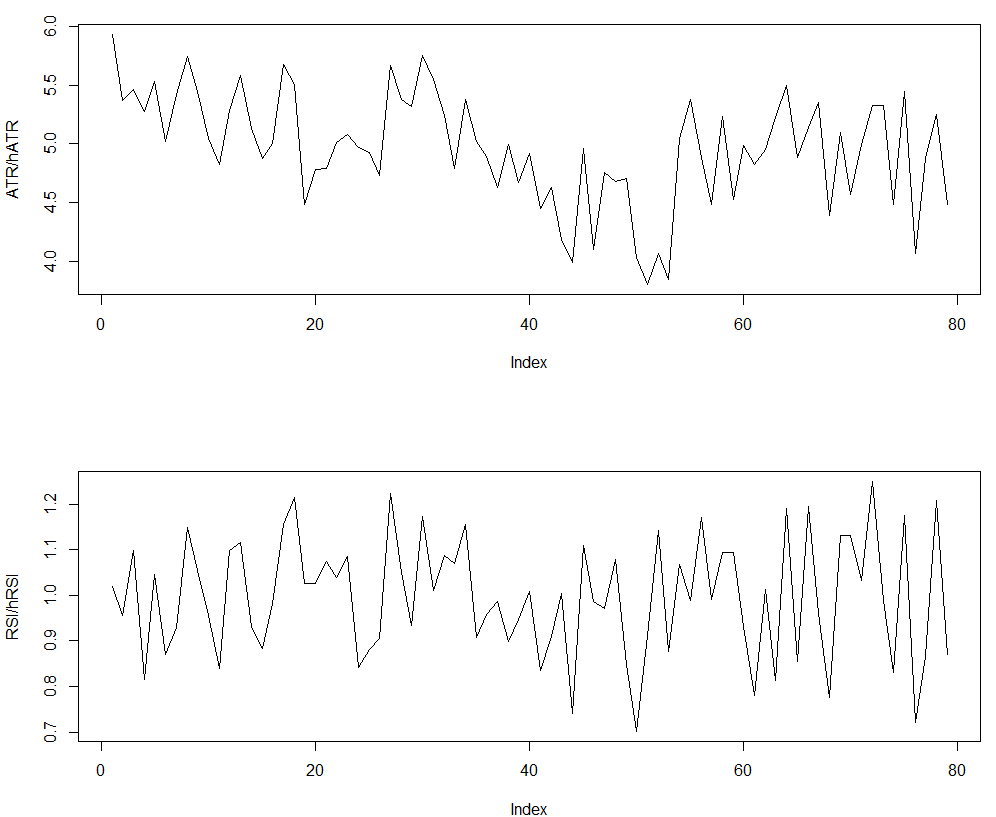
It is also worth considering how the proportionality between the daily/hourly values change through the years. We can see something very interesting through this analysis, as the daily/hourly ATR ratio has been decreasing somewhat steadily during the past 25 years. Note that the ratio decreased abruptly before the financial crisis (trimesters 40-60) but it then recovered and stayed within a somewhat wide range that seems to be getting lower as time progresses (a slightly down-trending channel). A decrease in this ratio suggests that the average hourly volatility is becoming larger in regards to the daily volatility, suggesting that price tends to walk more thoroughly through the daily candles. This means that instead of having 24 smaller candles filling the daily volatility you have 24 larger candles that simply do a more non-directional walk through the daily range. As the daily/hourly ATR ratio decreases conditions become harder to trade under lower time frames because directionality becomes harder to follow from lower time frame signals. The ratio between the RSI values doesn’t show a lot of action as it is significantly steady through time. However do note how the ratio also changes more sharply in recent years and to more extreme values.
–
–
Although I am certain that the above analysis is a gross simplification of what can be achieved with a more thorough look, it does give us some interesting information about the EUR/USD and how it has evolved historically regarding trending and volatility on the larger Vs lower time frames. Current market conditions have a low-directionality/low-volatility character but they unique in the sense that such conditions with such low daily to hourly ATR average values had never been seen in the past. The tendency of the daily/hourly ATR ratio to decrease seems to be historically established and therefore it is most likely permanent unless distressing market events happen. Such low ratios can be traded successfully provided overall directionality is high (as in 2007) but under low directionality conditions it seems to be a killer for trading strategies. An increase of long term directionality could give new life to some of these strategies that failed in 2013 and under current conditions.
I would therefore advice system developers to have strategies that can tackle current market conditions as whether we will have directionality or not (and how much is needed for a recovery) is unknown. A system developed to be profitable through the past several years (including current market conditions) might have a better chance of success, as it will succeed under both low and high volatility with high and low directionality. If you would like to learn more about system design and how you too can tackle the algorithmic trading game please consider joining Asirikuy.com, a website filled with educational videos, trading systems, development and a sound, honest and transparent approach towards automated trading in general . I hope you enjoyed this article ! :o)


Hi Daniel, interesting article.
I was wondering what you think about night scalpers that with acceptable risk:reward on pairs like GBP/CAD and GBP/CHF that trades in channels with adequate filters and indicators.
Obviously I am not referring to scalpers such as “Megadroid” which has a risk:reward of 10:1 (folly) but night scalpers with risk:reward ratio of 2:1 or better.
I think these EA can avoid the volatility of intraday nerve sessions and work well over the time without optimization, what do you think about that?
Kind Regards,
Hi Carmine,
Thanks for posting :o) I would say that due to the importance of historical spread and broker dependence for such systems, such scalpers would be very difficult to accurately simulate and therefore it would be difficult to know whether they have been profitable or not. However if you have proper bid/ask tick data for the broker where you intend to use the system and you have adequate software for the simulations there is no reason why you cannot try it. Slippage is also very important for such strategies so this effect also needs to be assessed. Personally I would not use such a strategy. Thanks again for writing,
Best Regards,
Daniel
hi Daniel
Is it fair to say then, based on your analysis with respect to the compression of the daily/hourly ATR ratio, that this market’s tendency to mean revert has been gradually increasing – perhaps suggesting that the market has become more “efficient”? A naive first observation in such a case could be that mean reversion driven strategies might be a better choice than trend followers?
mikko
Hi Mikko,
Thanks for your post :o) Well from this analysis this could be a rational hypothesis for testing but many more statistical tests would be needed in order to confirm that this makes the market more efficient in general. The issue is that mean reversion can also lead to inefficiencies if it’s predictable enough so to say that it makes the market “more efficient” might be an exaggeration from this small piece of research. Certainly a more probable hypothesis is that it makes the market more efficient against lower time frame trend followers but clearly this is hard to test as well. Thanks again for writing! :o)
Best Regards,
Daniel
Hi Daniel,
You surprised me with this post. I see nothing wrong with market conditions. In fact my fx systems did very well throughout 2013 and the second half was a little better than the first half. By now it should be clear to you that those systems that failed did so because they were poorly designed and primarily curve-fitted via processes that involve high data-mining bias that does not even have to be automatic, meaning that these system probably were not based on sound principles about trading. Trying to reverse to burden of failure on market behavior is like asserting that the short white man lost to the tall black man in a basketball challenge because the terrain was slippery. If a system cannot trade well in all market conditions then it is fitted to some conditions obviously. The issue is fitting, not market conditions. You are reversing the burden of failure. I hope you see what I am talking about. This is a common tendency of trying to find reasons for failures in data that is not appropriate for someone who has reached a certain level of accomplishment. The correct way to start is to admit that markets are always markets and try to find a system whose performance does not depend on changing market conditions. My 0.02 bitcoins.
Hi Bob,
I didn’t say everyone did bad ;o) I also had several systems that performed quite well in 2013-2014. Note that some of the systems that failed for me had years of profitable live trading and then they failed out of the blue in 2013-2014 (failure was because market conditions changed to something the systems couldn’t anticipate from previous data). As you say this is because they were obviously “fitted” to some set of market conditions that simply disappeared in mid-2013 and caused them to fail. What I wanted to do with this post was to attempt to find the source of that change (or at least a probable cause). Note that average algorithmic performance has also been poor since about 2012 (see indexes like the Barclay’s systematic trader index). Obviously any system you develop is created to work on historical data and therefore it is always “fitted” to some degree to what the past has to offer (every system is), understanding how the market changed to make several systems unprofitable is a good exercise in my opinion. You cannot develop a system that does not depend on changing market conditions, there is always a set of conditions your system won’t be able to handle and history is simply not large enough to prepare you for “anything”. I agree, we must strive to do this, to whichever extent it’s possible. However whenever systems fail I think it’s worthwhile to see why they did, what changed in the markets that made current conditions “different” from previous ones, especially when they fail after years of successful live trading. Thanks again for posting Bob :o)
Best Regards,
Daniel
My own system has indeed performing less good since middle of 2013 (EURUSD). What I noticed for EURUSD on the 5M timeframe (and also keeping an eye on the 1H), trends establish more quick (in the form of almost spikes), then tend to reverse back quickly again (you could also almost say in the form of spikes). Slow, long lasting trends into one direction are hard to find on the EURUSD nowadays, making trend followers and almost any type of system I am using within my strategy perform as worse as they ever did.
The system was developed on 5M data from 1999 to 2013 initially and while it´s still making good profits, it´s definitely A LOT slower than before. We are currently averaging 15 trades / month while until 2013 it had 35 / month.