When you start trading you often receive all kinds of advice regarding how to manage your positions to better favor your profitability in the Forex market. It is very common for new traders in forums to be advised to use favorable reward to risk ratios (like 3:1, 2:1) such that a winning trade will be 2x or 3x each losing trade. This advice to use a certain type of reward to risk configuration while lacking any knowledge of the inefficiency that a trader is attempting to exploit seems groundless, provided that on a random walk using random entries a trader using any risk to reward ratio will have exactly the same outcome: a negatively biased random walk determined by the spread. On today’s post we will explore whether there is actually some ideal, edge independent, risk to reward configuration, assuming that the trader has no statistical edge (trades at random) on real market data (EUR/USD, 2000-2014, 1H data). You will see that the results are quite surprising, showing us that there are indeed important differences between different risk to reward scenarios, despite the complete lack of a statistical edge within our trading results.
–
–
If a trader has no edge then losing money as time approaches infinity is absolutely guaranteed because the spread ensures that all traders with no statistical edges follow a negatively biased random walk that eventually leads to loses. However in shorter time scenarios (say 10 years) the number of traders that achieve spurious profit depends on the actual configuration that each trader uses for their trading. Since price across real market instruments rarely follows a perfect random walk and volatility behaves in rather specific ways, it is actually possible for some risk to reward scenarios to be favored against others, at least in the short term (slower convergence towards a negatively biased random walk). This means that there should be some ideal, edge independent, risk to reward configuration that will maximize the probability to achieve spurious profits within each financial instrument’s historical results. If an instrument trends more than it ranges then larger reward to risk ratios will be favored while if an instrument has mostly range traded then low reward to risk ratios will be favored as large excursions to take out larger stop-loss targets will be rarer.
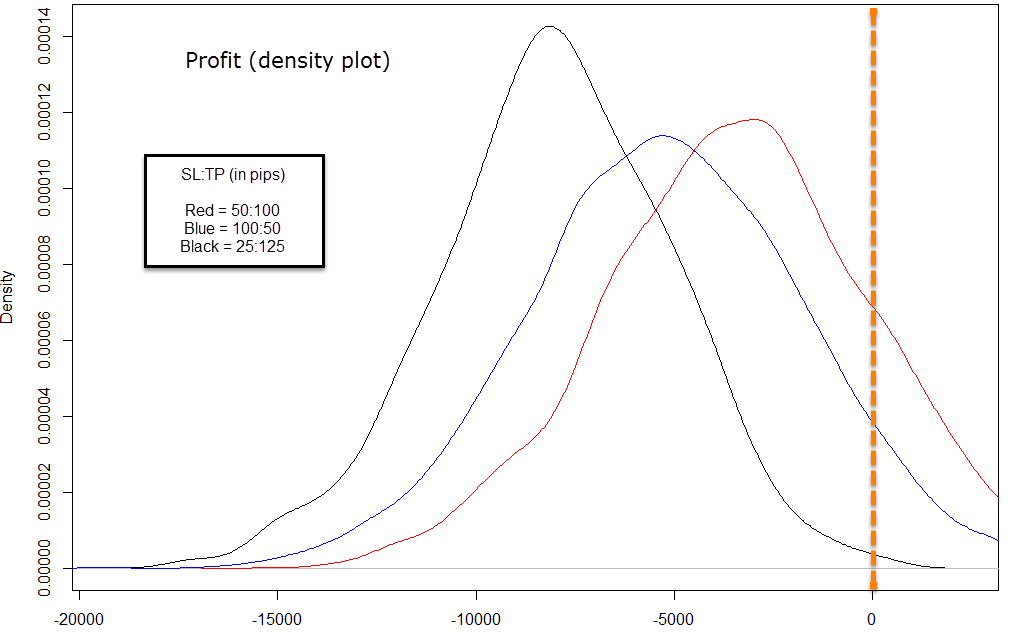
In order to test for this effect I carried out three tests for reward to risk values of 1:2 (red curves), 2:1 (blue curves) and 5:1 (black curves). The absolute values were (in pips) 50:100, 100:50 and 125:25. In each simulation an agent trades randomly with an entry probability of 10% and a 50/50 split between long and short trades on the EUR/USD 1H time-frame. For each test at least 10,000 simulations were carried out to ensure convergence, which was tested by repeating the tests from scratch and verifying that the results remained equal. After each test was completed the statistical characteristics of the distributions were analyzed using the R-studio statistical analysis software.
–
–
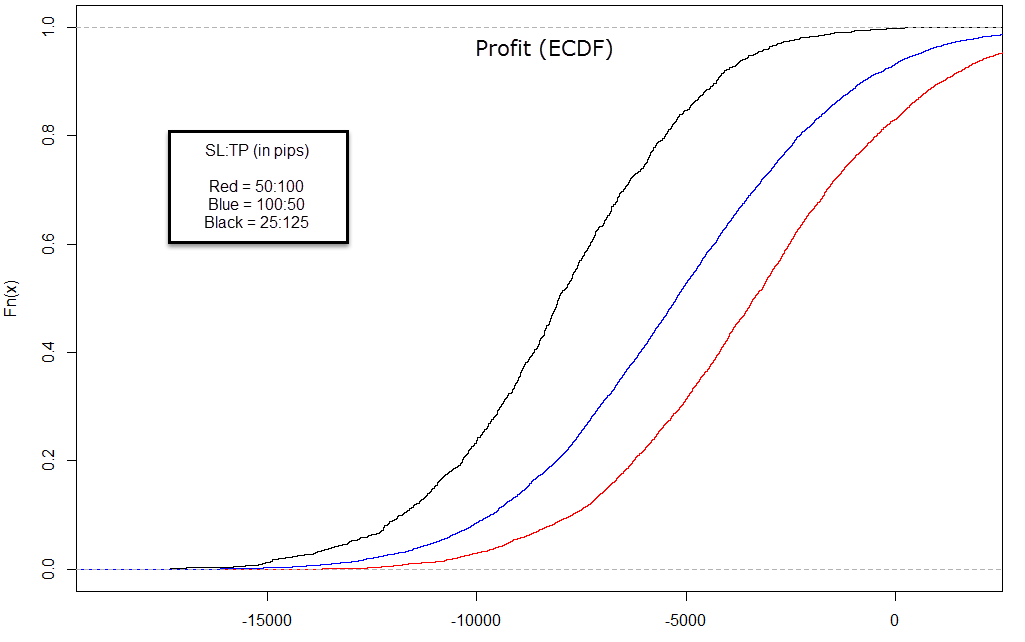
The results are actually very interesting. For a completely random instrument one would expect to find all distributions to be entirely equal or similar, with a failure to reject the null hypothesis of a Kolmogorov-Smirnov test, meaning that the samples couldn’t be said to come from different distributions. However what we find is actually very different as the three distributions of trading profits can be said to come from entirely different distributions (they are evidently different as you can see). The empirical cumulative distribution function (ECDF) of the distribution of profits clearly shows that the 2:1 case has a much higher probability to have profitable outcomes against the two other cases. However the worst performing case is actually the 5:1 case as the 25 pip stop-loss is evidently too easy to reach within the normal volatility movements of the EUR/USD (small ranges tend to be more than 25 pips wide).
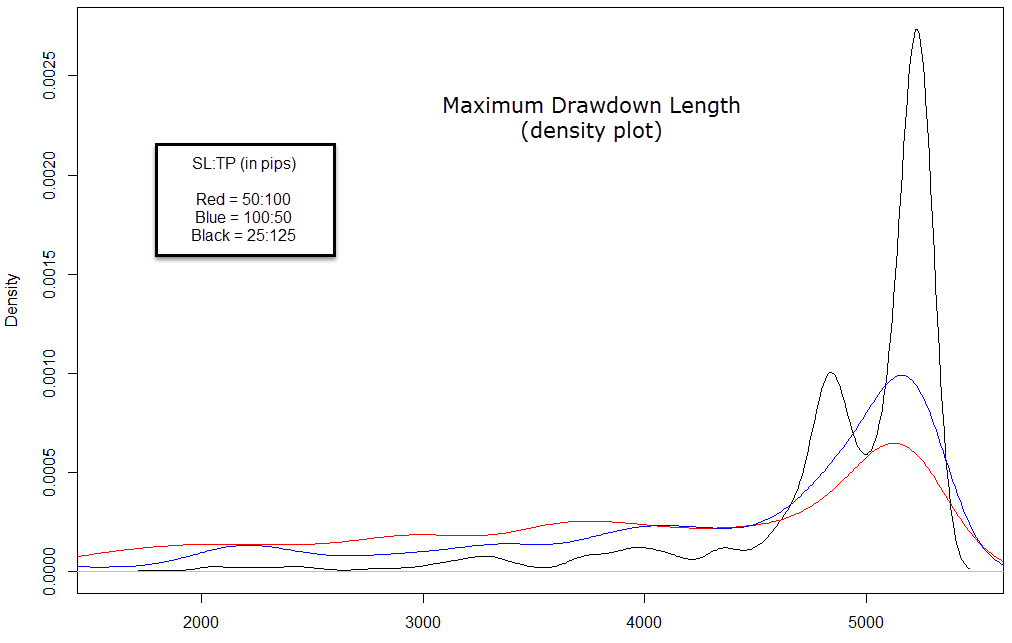
When looking at the Maximum drawdown length we have the exact same result. We see that the 2:1 test has the most favorable distribution with the frequency being much higher for lower maximum drawdown lengths when compared with the other two cases. However there is almost no difference between 2:1 and 1:2 in the best case as the minimum maximum drawdown length for the 2:1 case is actually 684 days while for the 1:2 case it’s 690 days. The difference however expands greatly for the 5:1 case, where the best case achieved is actually 1804. The 5:1 case indeed shows you that extreme reward to risk scenarios are very unfavorable because the volatility oscillations within the instrument do not favor profiting by chance in this scenario.
After obtaining these results we must be especially careful to draw any conclusions that may apply to real trading. What this is showing you is that the probability to achieve a profit spuriously on the EUR/USD within the past 10 years would have been much higher for someone trading a 2:1 reward to risk ratio. This explains quite well why this is such a common suggestion for new traders across forums as if you assume that most traders carry no edge, then those traders that made profits had a higher probability to do so if they were trading at this exact reward to risk ratio. Since the survival ratio of the 2:1 traders was higher, one would expect to encounter this advice far more frequently than the advice from say 5:1 traders, for which winning probability would have been extremely low.
–
–
Does this mean that you should develop systems with a 2:1 reward to risk ratio? Not precisely, this experiment says nothing about the development of systems with a statistical edge. As a matter of fact, distinguishing 2:1 systems that achieve good results through a true historical inefficiency from randomly good results would be harder, as achieving historically profitable results spuriously with a 2:1 ratio is more probable. However if you developed a 5:1 system that showed good statistical characteristics, it might be quite easy to prove it has an actual edge (at least historically) because the probability to achieve such good scenarios randomly (at least on the EUR/USD) is much lower. What these results are telling us is merely that in random, edge-less trading, the 2:1 scenario has had an advantage on the EUR/USD within the past ten years which at least in part explains the predominance of this suggestion for traders (as this reward to risk ratio was bound to be profitable for more traders, even those lacking edges). In summary, this is irrelevant when developing systems with real edges, provided you properly test your systems to ensure that they have a very low chance to come from randomness.
The above results clearly show that different risk to reward scenarios would have generated quite different success probabilities on edge-less trading within the past 10 years. This shows that the EUR/USD 1H timeframe does not behave as we would expect from a pure random walk and that this asymmetry may well lead to a higher survival rate for traders that committed to such scenarios. It would be interesting to analyze this across other timeframes and instruments in order to see how this may affect surviving edge-less trader populations across the board. If you think about it, stimulating a 2:1 reward to risk scenario choice would have been ideal for brokers as you would have encouraged a higher spuriously profitable crowd that would be able to pay spreads for a much longer time period without going broke (at least not so quickly).
If you would like to learn about system development and how you too can develop your own systems properly taking into account the probability of spurious profitability please consider joining Asirikuy.com, a website filled with educational videos, trading systems, development and a sound, honest and transparent approach towards automated trading in general . I hope you enjoyed this article ! :o)


Hallo Daniel,
Congratulations! Let me tell you that I am REALLY appreciating the direction your research is taking in the last posts, and especially these last two. Let’s say that you are coming very close to my research five or six years ago, although the conclusions and corollaries you make are even illuminating some of the results I couldn’t fully justify or deeply understand on my side at that time.
Allow me some comment:
1. Perhaps you will now agree that such kind of “random walk” experiments look very different from the “canonical” Monte Carlo simulations usually adopted in this field (scrambling the order of trading results), which assumes a normally distributed randomness in the market and does not takes into account the “time-series” nature of what we are studying. I would really appreciate your comments on this topic.
2. If you like I allow me to suggest some further lines of research. I would make them by myself, if I would not be completely “absorbed” by my (titanic and cumbersome) personal project.
A. A little (constructive) criticism. When I made things very similar to yours I noticed that a 2:1 r/r ratio is not equal to another. I mean: 50/100 pips behaves differently than 20:40 and 30:60. When you compare 50:100; 100:50 and 25:125 you risk to compare carrots with tomatoes. I would suggest you keep a fixed reference point, like the stop loss, for instance. Or using a relative one (z * ATR).
B. The perspective you have chosen, studying random walks for understanding “casual traders” is very attractive. But in this respect I fear you miss the target in the sense that i) “casual” traders are normally “non-systematic”, meaning that they would rarely stick to a “system” (if they have one) for long time, especially during draw-down periods. ii) The profit/loss scenario you present is also quite unrealistic because you stick to the linear money management. A thing I would now add to your analysis would be like: use a compounding MM scheme, and then study the cumulative distribution of returns up to a certain fixed “treasure target”. It could be: you stop the trading stream as soon you reach 10x (or any fixed amount) initial trading capital. I suppose two things: i) the percentage of “successful” traders (the ones reaching the treasure) will increase (the distribution will be skewed towards positive territory) ii) I am sure that any of those “(casually) successful casual traders” would feel as a “market guru”, probably stop trading, and preach the world that they have found the holy grail.
C. It would be overly interesting, in your scenario, looking at some more sophisticated trade management scheme, like for instance trailing stops. This could be something that even “casual traders” could adopt systematically.
Your research is great, and the interesting issue you are bringing up is really what is the real “structure” of the market and how to measure deviation of systemic trading results from the ones generated randomly (the famous “edge”, where you know my scarce satisfaction of canonical methods for measuring it). I also fully follow you when you mention that the whole research now needs to have a “validation” by verifying conclusion on a “test” set (like another currency) after having used the time-series EURUSD 2000-2014 as a “training” set.
I eagerly keep tuned.
Bye
Fabio
Hi Fabio,
Thanks a lot for your comment :o) I am glad you like this research line (I thought you would since I remember you inquiring about doing this sort of thing in F4). Let me now answer your questions/comments:
1. I would agree with you in that they give a different view, they do offer a perspective that is clearly more realistic when looking at the results that were historically plausible. While a traditional MC simulation will give you hypothetical scenarios that are outside of what was possible historically, these results are much more grounded in what actually happened. However MC simulations have a place and use for certain things where these simulations simply can’t be used (for example assessing the worst case scenarios derived from the trade chain of a system with a given fixed logic).
2.
A. Yes, I do agree with you, every scenario considered in absolute term might be different. I was merely interested here in showing that all risk to reward scenarios are not equivalent. Clearly there might be something even better or worse along the entire SL/TP parameter space.
B. i) I do not assume that traders stick to any system, this is why their entries are random. I simply assume here that they stick to an SL/TP management scheme, sure, this is an approximation but I believe that while a trader may be unable to stick with some entry rules they might be able to more easily stick to an arbitrary position management scheme. ii) I do this to present the profit/loss in pips, which exemplifies profit/loss in net terms. Sure, what you say is also an interesting, yet different experiment. If you increase risk enough to reach 10x with a high probability within the random entry space you would certainly increase the number of losers that reach account wipeouts by a very large amount. I will carry out this experiment and will let you know ;o).
C: Yes, it’s interesting to consider the idea of how more complex money management may affect random trading outcomes. I will add this to my to-do list.
Again I’m glad that you like this research path :o) Thanks again for commenting Fabio, it’s always a pleasure to have you around,
Best Regards,
Daniel
If the blue is in between the black and the red, how can it be the best strategy ?
The best is the red, not the blue. The red is the 2:1 reward to risk ratio. 50SL:100TP