Since around 2010 I have been using the free services of companies like myfxbook to keep track of the performance of my live/demo trading accounts in order to make result tracking easier to do. Although I had developed some software experiments for the tracking of live results independently in the past it had simply always been more convenient to use companies like this for result tracking. However I have recently become aware of several problems with the results from these companies – inaccuracies in their calculations – which have led me to the creation of scripts that can carry out direct result extraction and analysis without the need for any third party service. Through this article I will share with you a script that can carry out this analysis for your Oanda REST APIv as well as some information about the mistakes you can expect when using Oanda with third-party services like myfxbook. You can download the script and modified oanda.py file here.
–
#!/usr/bin/python
# Daniel Fernandez, Jorge Ferrando
# https://asirikuy.com
# http://mechanicalForex.com
# Copyright 2016

import pandas as pd
import numpy as np
import time
import math
import ConfigParser, argparse, logging, zipfile, urllib, json
from time import sleep
from oanda import *
import matplotlib.pyplot as plt
import matplotlib.dates as mdates
import qqpat
import datetime
import sys, traceback

def lastValue(x):
    try:
        reply = x[-1]
    except:
        reply = None
    return reply

def get_zip(url):
    zip, headers = urllib.urlretrieve(url)
    with zipfile.ZipFile(zip) as zf:
        files = [name for name in zf.namelist() if name.endswith('.json')]
        for filename in files:
            data = zf.read(filename)

    return json.loads(data)

def main():


    dateFormat = mdates.DateFormatter("%d/%m/%y")

    #place account id and REST token in the variables below
    account_id = "place v1 account ID here"
    token = "place v1 REST token here"

    # change from "live" to "practice" if this is a demo account
    oanda = API(environment="live", access_token=token)

    oanda_account = oanda.get_account(account_id)
    account_balance = oanda_account['balance']
    account_equity = account_balance + oanda_account['unrealizedPl']
    account_floating = 100*(oanda_account['unrealizedPl']/account_balance)
    response = oanda.get_all_transactions(account_id, oanda)
    location = response.headers['Location']

    r = requests.get(location)
    while r.status_code == 404:
    	r = requests.get(location)
        print "Waiting for transactions... Sleeping for 2 seconds"
        time.sleep(2)

    transactions = get_zip(location)
    returns = []
    dates = []
    lastBalance = account_balance

    for transaction in transactions:
    	if transaction['type'] == 'MARKET_ORDER_CREATE':
	    returns.append(float(transaction['pl']) / (float(transaction['accountBalance'])-float(transaction['pl'])))
            dates.append(transaction['time'])
	    lastBalance = float(transaction['accountBalance'])
        elif transaction['type'] == 'DAILY_INTEREST':
            returns.append(float(transaction['interest']) /( float(transaction['accountBalance'])-
float(transaction['interest'])))
            dates.append(transaction['time'])
            lastBalance = float(transaction['accountBalance'])
        else:
             pass
             #print transaction

    dates.append(datetime.datetime.now())
    returns.append((lastBalance-account_balance)/account_balance)
    s = pd.DataFrame({'profit': returns}, index=pd.DatetimeIndex(dates))
    balance = (1 + s).cumprod()

    total_return = 100*(balance['profit'].iloc[-1]-balance['profit'].iloc[0])/balance['profit'].iloc[0]

    fig, ax = plt.subplots()
    ax.plot(balance.index, balance['profit'])
    ax.xaxis.set_major_formatter(dateFormat)
    plt.xticks(rotation=45)
    plt.show()

    age = (balance.index[-1]-balance.index[0]).days
    s = balance.resample('D').apply(lastValue)
    s = s.pct_change(fill_method='pad').fillna(0)
    m = balance.resample('M').apply(lastValue)
    m = m.pct_change(fill_method='pad').fillna(0)
    w = balance.resample('W').apply(lastValue)
    w = w.pct_change(fill_method='pad').fillna(0)

    try:
    	analyzer = qqpat.Analizer(s, column_type='return', titles=["profit"])
        cagr = analyzer.get_cagr()[0]
        sharpe = analyzer.get_sharpe_ratio()[0]
        maxdd = analyzer.get_max_dd()[0]
    except:
        cagr = 0.0
        sharpe = 0.0
        maxdd = 0.0

    avg_daily = np.asarray(s).mean()
    avg_weekly = np.asarray(w).mean()
    avg_monthly = np.asarray(m).mean()

    print "Total Profit: {}%".format(total_return)
    print "Balance: {}".format(account_balance)
    print "Equity: {}".format(account_equity)
    print "Floating PL: {}%".format(account_floating)
    print "Account age: {} days".format(age)
    print "Maximum DD: {}%".format(maxdd*100)
    print "CAGR: {}%".format(cagr*100)
    print "Sharpe: {}".format(sharpe)
    print "Avg daily P/L: {}%".format(avg_daily*100)
    print "Avg monthly P/L: {}%".format(avg_monthly*100)
    print "Avg weekly P/L: {}%".format(avg_weekly*100)


##################################
###           MAIN           ####
##################################

if __name__ == "__main__": main()
–
The first time I noticed the problems with myfxbook and Oanda was two weeks ago after I added a new account that I wanted to track there. Sadly this new addition caused all my accounts to become disconnected and no matter how many times I readded or reconnected accounts they would never be connected (they remain disconnected to this day, with more than 9500+ minutes since the last update). Contacting myfxbook didn’t help as although they said they were tracking the problem the issue simply was not fixed. Since I needed to have my account data updated for the Asirikuy weekly newsletter I decided to code some scripts to get all the account information using the Oanda REST API and do all the needed statistical calculations myself. This is when I realized that there were lots of things wrong with the myfxbook calculations I had been trusting up until this point.
I started to notice that my scripts were giving me very different statistics when compared with the myfxbook statistics. After careful analysis of the account results I could see that my calculations were correct but those from myfxbook were off significantly. The reason seems to be that Oanda can trade extremely low lot sizes – 0.00001 lots – and myfxbook performs a rounding exercise that significantly affects the calculation of statistics when the traded lot sizes are this low. This rounding does not affect results when you’re using large lot sizes, say the 0.01 that are most commonly available in retail FX brokers, but it does cause a terrible problem when you go to the lot sizes that you can in fact trade with Oanda. This means that you should not trust myfxbook results if your traded lot sizes are of this magnitude.
–

–
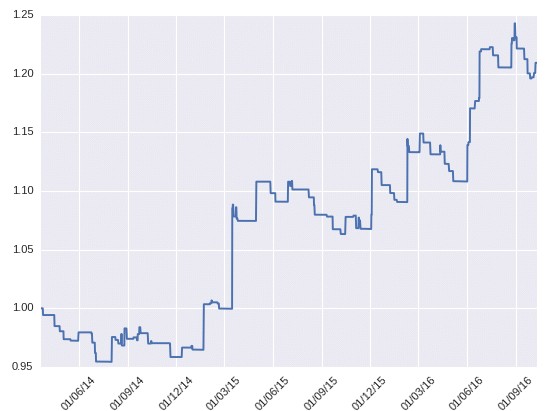
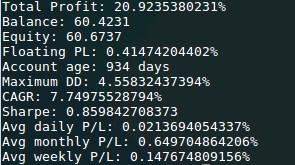
To remedy this problem I decided to move entirely away from myfxbook and into my own scripts. The above python script is a stand-alone reduced script taken from the scripts I use to update the live results webpage at Asirikuy. It uses a modified oanda.py file containing the oanda v1 REST API implementation and is able to extract all transaction information, create a balance plot – as showed above – and calculate a set of basic statistics as showed below. As you can see the script uses the qqpat library for the extraction of the statistics so you can easily use any functions in the qqpat library to calculate any additional statistics you might want to use. I decided to calculate this set of statistics as they are the ones I watch the most often but if you want you can calculate other statistics such as the Omega ratio, MAR ratio, pearson correlation, etc. You can even use the qqpat functions to create additional graphs such as a return analysis, rolling standard deviation/sharpe analysis, etc. You may want to use the get_statistics_summary function that creates a dictionary containing all the statistics available from the qqpat library.
Before using the above script make sure you have python 2.7 and the qqpat library installed. After that you should simply change the account_id and token variables to the account ID and REST API token for your account. You should also change the “environment” variable in line 45 to either “live” or “practice” depending on whether you are trying to extract results from a demo or live trading account. Note that this script only works with v1 REST API accounts so if you want to use a v2 REST API account you should modify the script accordingly, this might involve some non-trivial modifications such as changing function calls and the oanda.py file to the v2 REST API file available from the people at Oanda. The above script displays results for a single account so you can have one script for each one of your accounts or modify the above script to loop around a given number of account ID values.
–

–
Account monitoring becomes a breeze with the above script and you can rest assured that the results are accurate and that you’ll be able to change the displayed statistics to fit your own needs. This gives you a very much needed independence from third-party services and gives you the ability to get updated account results whenever you deem necessary instead of having to rely on an automated account updating schedule that may update more or less frequently than needed. If you would like to learn more about FX trading and how you too can trade using a repository containing thousands of strategies please consider joining Asirikuy.com, a website filled with educational videos, trading systems, development and a sound, honest and transparent approach towards automated trading.strategies


