During the past couple of months I have written several posts about system evaluation, worst-case scenarios and the estimations of these values through the use of formal statistical tools. One of the “easiest” ways in which we can obtain such pessimistic formal values for our systems is through the use of Monte Carlo simulations. If you are not familiarized with what a Monte Carlo simulation is or how it can help you evaluate the worst case characteristics of your system then you might consider reading this post where I explain some of the basics of the Monte Carlo procedure and how this leads to the determination of very robust – even sometimes too pessimistic – worst case values. On today’s post I am going to talk about our latest implementation of this type of simulations within Asirikuy, our very own program to perform Monte Carlo runs.
Previously in Asirikuy we had been using a freely available spreadsheet to run Monte Carlo simulations of our systems, however this spreadsheet didn’t fulfill all our needs as it didn’t accurately portray the behavior of our systems since risks were calculated as fixed values and not as a percentage of the previously available balance (which is what Asirikuy systems actually do in most cases). For this reason it became obvious that if we truly wanted reliable Monte Carlo simulations we would have to build a program to carry them out in such a way that they would correctly simulate our systems’ risk-per-position behavior.
–
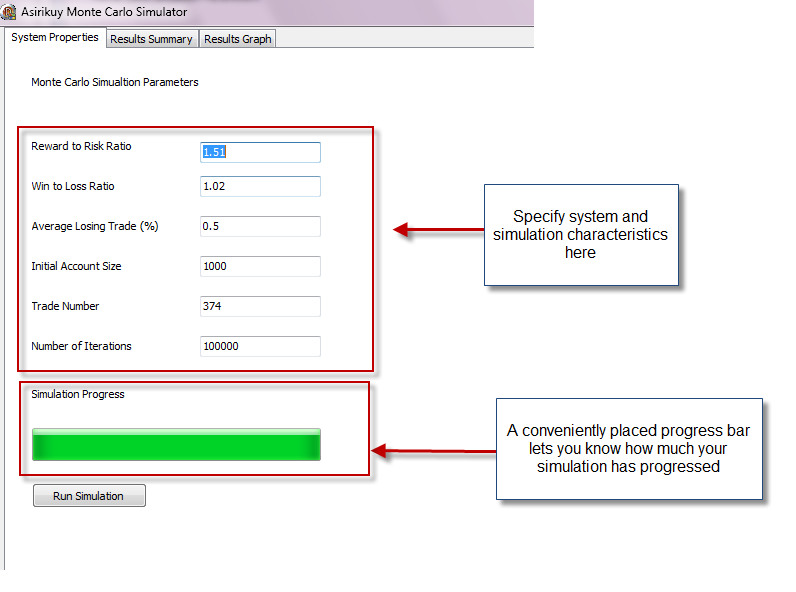
In order to solve this important problem I decided to code a Monte Carlo simulator for the Asirikuy community which was able to perform the above mentioned tasks. Since I am a big Pascal fan I decided to code the program using Delphi 2010, the same development suite I used to code the Asirikuy spread changer program. The result of this effort was a very light and efficient program which is able to quickly carry out extensive Monte Carlo simulations with straight information from our Asirikuy profit/draw down analysis tool, taking into account the way in which Asirikuy systems work, ensuring that the simulations are in fact representative of our system’s statistical behavior.
Perhaps the greatest improvement when compared to the spreadsheet we were previously using is the speed in which simulations are carried out. Since the program doesn’t need to run on a very bloated Excel interface but it now stores all values on a very efficient Pascal array structure, it becomes possible to carry out a 100K iteration 400 trade Monte Carlo simulation (which is a combination of 100K, 400 trade runs) in about 30 seconds while the Excel spreadsheet took almost 55 minutes, an overall improvement in speed of almost 100x.
–
Another extremely important achievement is the fact that the new program does assume that each trade uses the past trade’s balance (accurately portraying losses as percentages of previous equity on each iteration) while the spreadsheet assumed all losses/profits were a fixed percentage of initial equity. This allows us to have an accurate picture of the behavior of our systems while the spreadsheet only gave a mere approximation, very good or bad depending on the exact system being evaluated and how steeply it deviated from linear behavior.
The entering of simulation parameters wasn’t also very convenient with the spreadsheet (in which a cumbersome process of editing and removing cells was necessary to increase trade number and a few manual calculations needed to be done to get the desired information from our analysis tool) while this new Monte Carlo simulator allows us to enter direct information from our analysis tool in the form of win to loss ratio, reward to risk ratio, average losing trade in terms of percentages, etc. Another neat addition is the use of a progress bar which shows the user how the simulation is advancing.
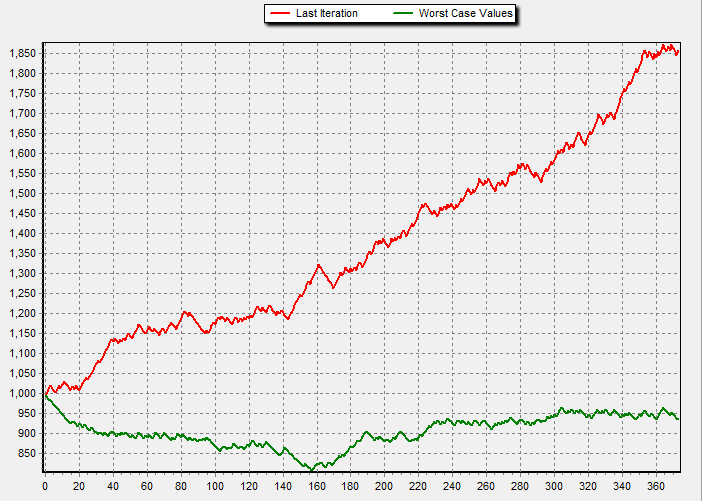
Finally this simulator also implements a charting solution (Delphi has perhaps one of the best charting solutions ever) allowing us to see the results of our simulation (last iteration and worst case values of each trade through the whole 100K (or whatever iteration number) set). Another page also prints the simulation results as maximum consecutive profitable/losing trades and the worst case maximum draw down calculated as the worst case draw down on any single simulation over the whole iteration set.
This new program will definitely become an important part of our Asirikuy set of analysis programs (it will be released this Sunday in Asirikuy). During the next few weeks I will also add other statistical calculations to the program which will improve its ability to give Asirikuy members accurate worst case scenarios for the trading of our automated trading solutions. If you would like to learn more about system evaluation techniques and how you too can develop your own automated trading strategies with formally determined worst case scenarios please consider joining Asirikuy.com, a website filled with educational videos, trading systems, development and a sound, honest and transparent approach to automated trading in general . I hope you enjoyed this article ! :o)


What an awesome addition to our toolset – and just in time for Christmas! I look forward to playing with our new toy this weekend :-)