There are many different methods that a quantitative trader can use to attempt to predict financial time series. On this blog I have discussed neural networks to achieve this goal but today I want to show you some results using much simpler machine learning techniques. Through the following paragraphs you will be able to see the results of some simple linear classifier algorithms as well as how simple changes, thresholds and committee building efforts can improve our results when building real trading systems. I will first show you the initial results for linear classifier setups and I will then go through some of the modifications needed to improve them as much as possible. By using linear classifiers to achieve results with profitability above random chance, we can say that significant complexity in machine learning techniques is not necessary for the building of trading strategies.
When people think about machine learning in trading they usually picture non-linear, complex models such as neural networks and support vector machines. Although these models can indeed be used to construct successful trading techniques, it is interesting to wonder whether we can construct a successful trading approach using a set of computationally cheaper classifying or regression techniques. The idea of using linear methods is interesting because they provide very light machine learning models that can be used to construct complex architectures for predicting that are difficult to build with NN or SVM due to the computational power required to carry out simulations. When using computationally cheap methods it is feasible to do things like a 200 model committee while with complex non-linear models it would take a lot of time to run such back-tests.
To test whether linear classifiers (LC) have any merit I first tested a simple Linear mapping method, as it is implemented within the Shark machine learning library. My first approach was to simply attempt to predict whether the next bar is bearish or bullish by using the bearish/bullish classification of the previous N bars. Usually – as it is my experience with more complex machine learning methods – using a large number of bars is detrimental, so I carried out tests using a small number of bars. Note that in my back-tests the machine learning method is retrained on every bar using the past B number of bars to make a prediction for that bar, with the retraining process being repeated after every bar. These tests were done on the EUR/USD daily time frame, using data from 1988-2013 (data prior to 2000 belong to the DEM/USD). In order to evaluate the models I use the real back-testing performance as prediction accuracy tests can be misleading (since we’re not only interested on whether or not we can predict but on whether or not we can make money). All simulations showed here are non-compounding.
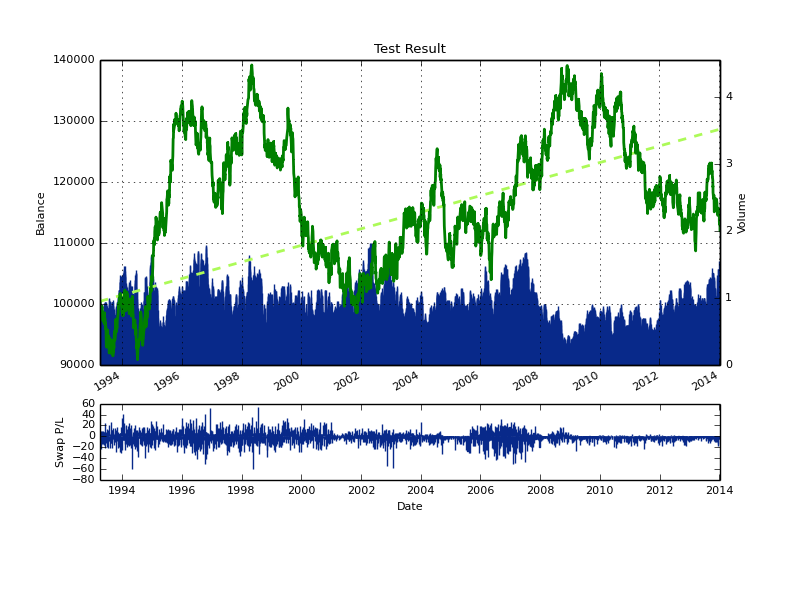
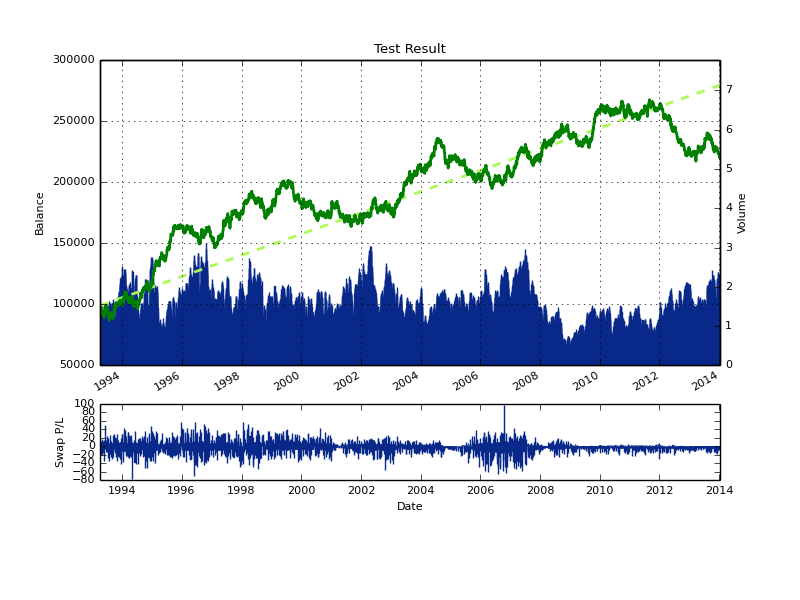
The result for the first test (above) show us that the LC method by itself is not very profitable overall. The method achieves a slight profit over 25 year period but the drawdowns are extremely large (>40%) and the technique clearly does not work well under all market conditions (highly unstable). The reason for this instability can potentially be assigned to large loses suffered on intra-bar movements as the LC is not able to close positions mid-bar. The first measure I usually take improve the historical trading results of an ML technique is to add a stop-loss which can reduce the problem of getting large loses whenever single predictions are wrong on large bars. Doing this in effect improves the strategy considerably, yielding the results you see below, where you can see that the stability of the ML technique has improved quite considerably. However the results still have some undesirable characteristics, such as very long drawdown lengths and a sharp drawdown period within the end of the back-tests.
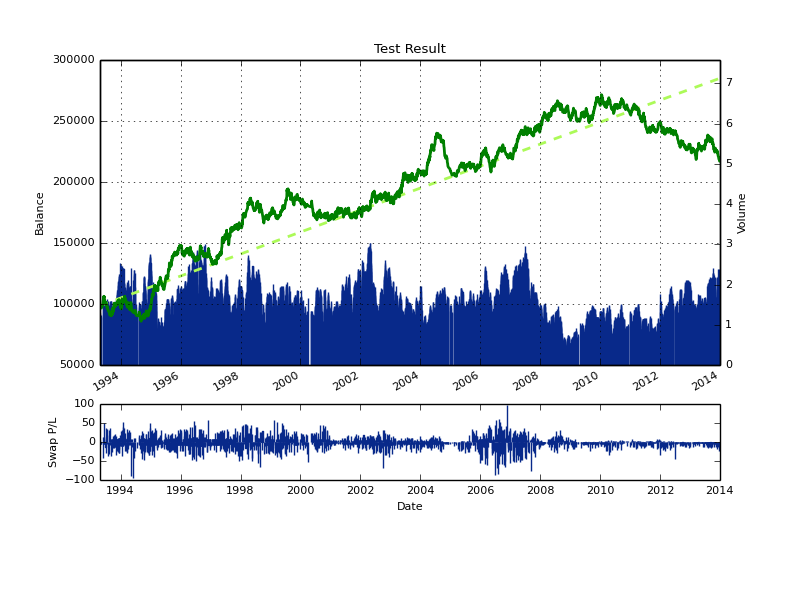
The next thing we can do to improve our results is to put different LC together in order to increase our prediction accuracy. Any machine learning method has a given learning period (uses a given number of past examples to learn) so the simplest way to generate a committee (also reducing the degrees of freedom of the strategy) is to generate LC results for a wide variety of learning examples (from 25 to 250 for example) and then poll the results to make decisions for trading. Putting 250 different LC together to make predictions through a majority vote (go long if +50% say long and go short if +50% say short) generates the results showed below. As you can see the LC technique improves significantly from 1994-2010, but we still suffer from a very significant drawdown period at the end of the test. Now that we have high relatively high linearity within the first part of the test, our concern should be to eliminate or at least alleviate the regime change near the end of the test.
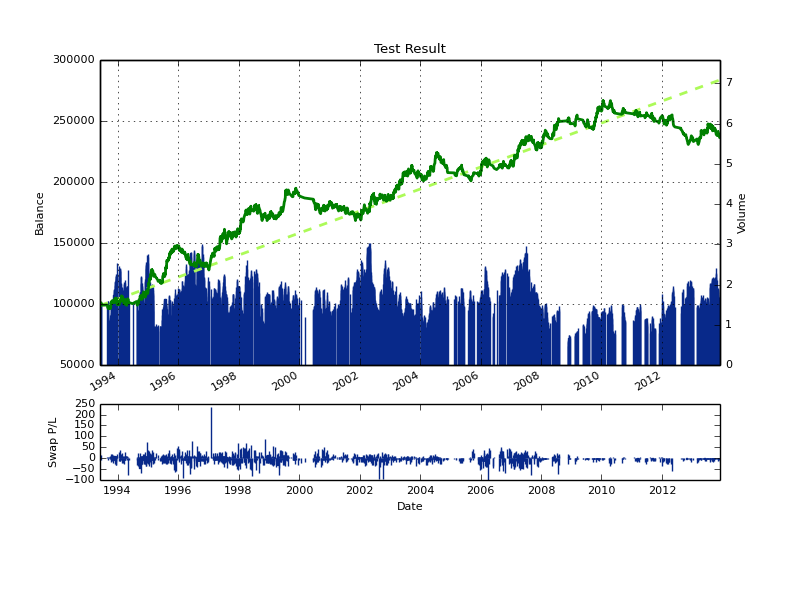
When using a committee of machine learning instances one of the variables you can play with (an additional degree of freedom introduced by the use of a committee) is the voting threshold necessary to make trading decisions. Using a 50/50 model improves results – as showed above – but it’s worth asking whether making trading harder (increasing the minimum vote threshold) improves the result of the LC group. Doing this can in fact make the results better and in fact it can decrease the depth of the drawdown period near the end of the back-test without damaging the performance of the first 80% (in fact it makes it slightly better). You can also see that period of indecision in the group are generally clustered together, meaning that in general we’re avoiding market conditions were decisions are in essence unclear. However it is also clear that the drawdown near the end does not disappear, so it is simply a consequence of the model and predictors we are using.
Certainly the above can be improved a lot further (future post!) by including either other input types or other types of linear methods (like regression based methods), you can also potentially improve the above by making a committee that is more diverse (containing for example other variations of the number of bars used per each example created) or you can also attempt to increase profitability by using better position management methods (like a dynamic SL for example). If you would like to learn more about machine learning in trading and how you too can use NN based techniques to trade the FX market please consider joining Asirikuy.com, a website filled with educational videos, trading systems, development and a sound, honest and transparent approach towards automated trading in general . I hope you enjoyed this article ! :o)


What about the rigourus analisys you’ve done about overfitting, data mining, data snooping and so on? If i remember you generate in R artificial time series to see if machine learning strategies can beat random noise with a good degree of confidence. Can you expand about it?
Hi Daniel,
another well structured article – thank you.
Small typo: “improve the above my (by) making a committee”
One thing is worth mentioning: It should be clear that the improvements you undertake in terms of free parameter selection (e.g. voting scheme/ number of inputs) always add bias to you model, and that real performance measure can only be derived after any sort of tweaking.
You mention this in several other articles, i just thought it is important to make people aware again :)
Cheers
Fabwa
Hi Fabwa,
Thanks for your comment :o) I have now fixed the typo. Sure, you’re right in that all these additional schemes add bias (difficult to measure how much as well), I would advocate for some good degree of demo testing of any machine learning strategy to ensure that your data-mining bias is not big. Since true out-of-sample testing is not possible with historical data (you’ll always repeat tests and tweak until you find something that works best historically, despite how you split your historical data), this is the only option for true validation of the voting scheme and input choices before actually trading live.
However some of these measures might actually reduce bias compared to a single machine learning technique. For example a large committee of linear classifiers does not make a choice regarding the learning period (all periods that can be used are used), so the bias in the voting variable is actually less than the bias in choosing the single best performing learning period in the past. This is also worth considering :o) Thanks again for commenting,
Best Regards,
Daniel