During the past few weeks we have been looking at the results of random trading on the EUR/USD, particularly at the distribution characteristics of random trader outcomes during the 2000-2014 period. On a previous post we discussed how introducing a trending bias can heavily impact the results for random traders, although the small trending bias used (2 days) did not have a very large effect on the average profitability. Today we are going to look at what happens when traders are biased towards a much stronger trend (higher look-back periods) and we’ll analyze the huge effect this has on overall random trader outcome distributions. By looking at these results we’ll see that there has been an ideal trending bias for the past 14 years and we’ll be able to quantify the difference with regular unbiased random traders and traders with different look-back periods on their trending bias. This small study does show that trend-following can dramatically change random trading outcomes on the EUR/USD.
–

–
To obtain these results random trader outcomes were generated by carrying out 10,000 simulations for each test. Trading was carried out on the EUR/USD 1H data from 2000 to 2014 with a constant spread of 3 pips. Traders had a 10% chance to enter new trades on each 1H bar open if no trades were opened and positions were always entered with a 100/100 pip stop-loss/take profit and left like that until closure. For traders with a trending bias positions were only opened in the direction of price movement within the past X bars (only longs if the current open and the open X bars in the past is positive, only shorts if the difference is negative). Unbiased random traders were able to always open either long or short trades with a 50% probability. The 10,000 simulations were also repeated on each test to ensure that the results were convergent (conclusions were the same on separate 10,000 runs). Simulation sets to analyze trending biases using look-back periods of 10, 20 and 30 days were carried out, as well as a simulation with no trending bias (as a control).
–
–
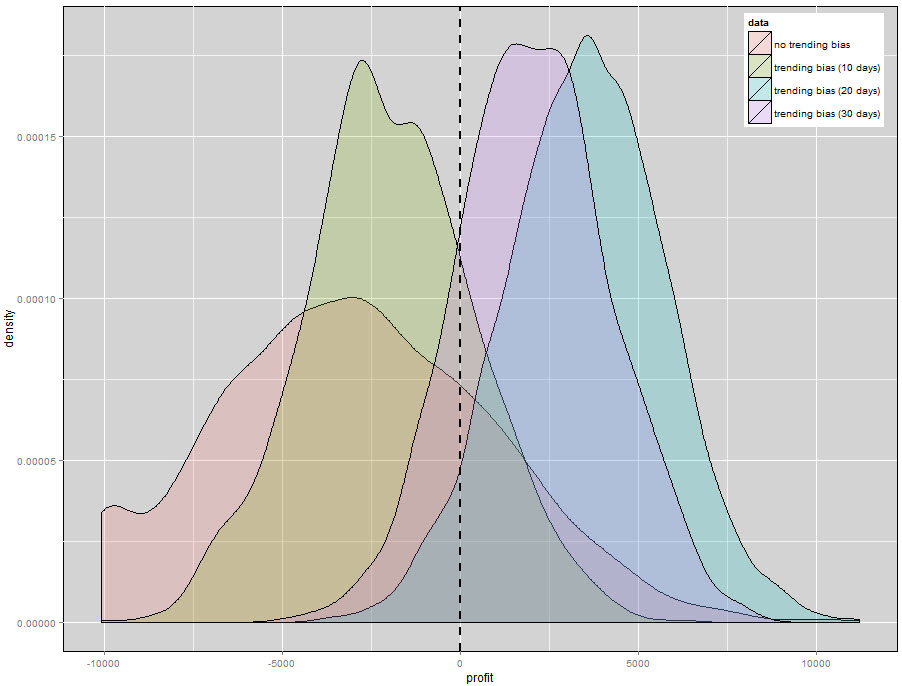
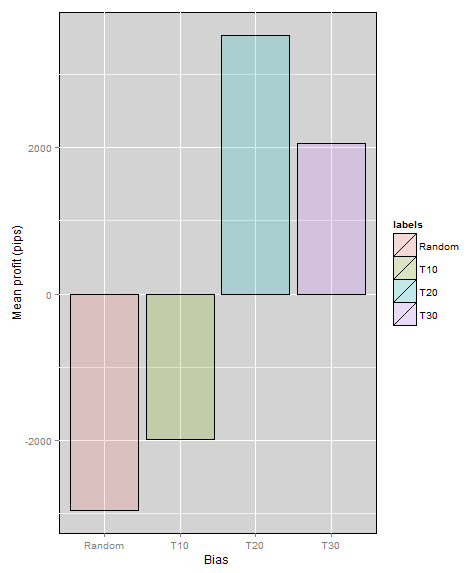
The results for larger look-back period are very different when compared with the 2 day results on my last blog post. The profit (pips) distribution above already shows the dramatic shift in the profitability of random traders when subjected to trending biases with larger look-back periods. Traders using 10 day look-back periods are still unprofitable while traders with 20 and 30 day look-back periods actually had a majority of profitable outcomes. The mean of the distribution (next image) actually shows that the results are overall positive for the 20 and 30 day look-back periods, showing that the probability to be profitable if trading with the 20 and 30 day trends was very high within the past 14 years. We already see here that the 20 day period is the best performing outcome in terms of profitability as profits start to drop when we move towards a larger look-back period (30 days). It is worth remembering that all entries are still completely random, merely influences in terms of directionality by the trending bias.
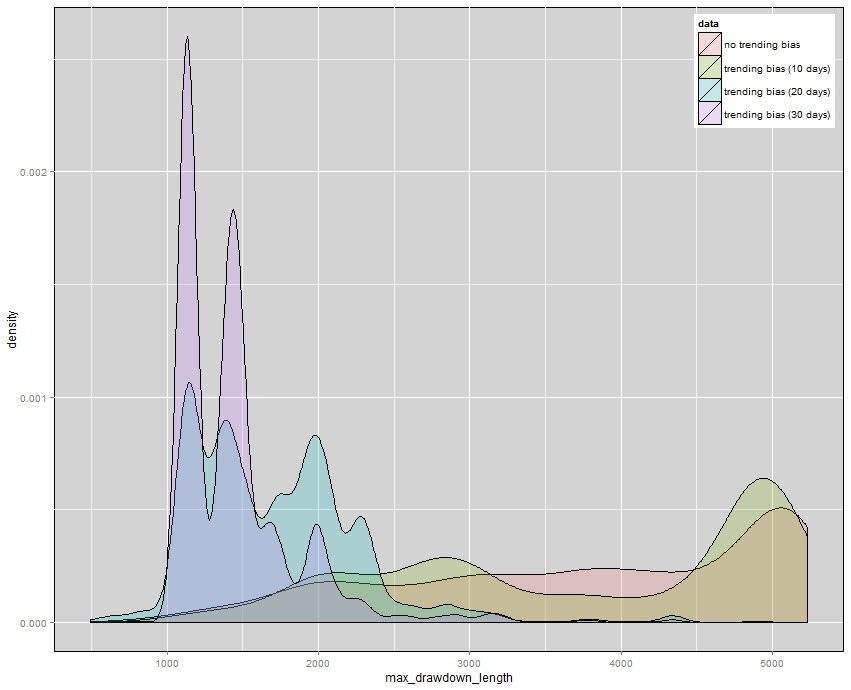
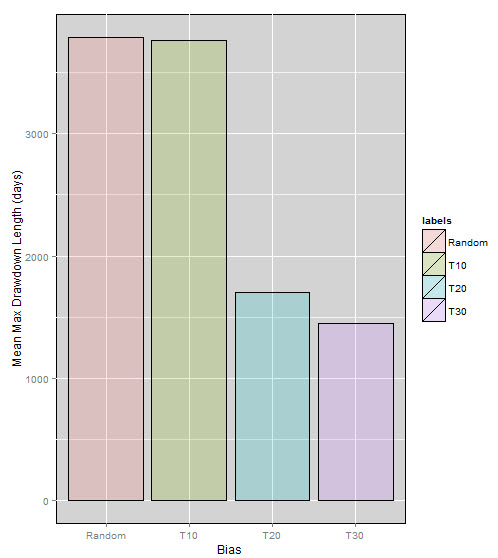
There is also a very interesting effect in terms of the maximum drawdown lengths when we look at the results. The mean value for this statistic drops dramatically when going to larger look-back periods, with the results being in the order of 1700 days. In this case the 30 day look-back period has a slight advantage with a maximum drawdown period length average below the 1500 day mark. This means that while profitability was smaller, the overall duration of the longest drawdown period dropped significantly. We can also see this transformation when looking at the maximum drawdown length distributions for all cases. We can see that the unbiased random traders and 10 day look-back period traders have almost the same distribution with only a small number of feature differences while when we move towards higher look-back periods the distribution starts to shift heavily towards two peaks in the 1000-1500 region. As a matter of fact the probability to have a maximum drawdown length near 1000 days is dramatically higher than the probability to have almost any other drawdown within the 30 look-back period simulations.
–

–
These results are actually quite interesting because they show that following long term daily trends has been a strategy that has made sense during the past 14 years on the EUR/USD. The exact entry mechanism used practically does not matter since as long as you would have been following the 20-30 day trend you would have had a very good chance to end the past 14 years at a significant profit. This resonates with the advice given to new traders to always “follow the trend”, since the EUR/USD is the most liquid FX asset (the asset mostly traded by retail traders due to its low spread) it is easy to imagine how the majority of people following some sort of system with long term trend following filters achieved an overall positive result. This would be especially true for trades who avoided the most largely prevalent drawdown periods for trend followers (around 2004-2007) since these traders would have seen trend following working quite exquisitely during the past 6 years.
–
–
However the results on the EUR/USD are by far not the rule in the FX market. As a matter of fact trend following can be shown to be a very bad historical decision across some pairs, reason why it does not make sense to adopt trend following as a general strategy in FX trading. Moreover this shows that the EUR/USD is in fact quite unique among other FX pairs in that the effect of using a simple trend following bias can have such a huge impact in historical trading results for large groups of random traders. This is something that you won’t see for any other FX pair and in fact the opposite strategy often resonates quite strongly for other symbols, especially those with lower liquidity levels. During my next few posts we will be giving the FX market and trending biases a far more generic look, we’ll see how trend-following bias affects random trader outcomes across other pairs and how counter-trend-following bias can also have a positive impact, depending on the traded symbol and look-back periods used.
If you would like to learn more about system building and how you too can create your own strategies using automated system building tools please consider joining Asirikuy.com, a website filled with educational videos, trading systems, development and a sound, honest and transparent approach towards automated trading in general . I hope you enjoyed this article ! :o)


