Across some of my recent posts we have explored how random trading scenarios change relative to growth targets and risk to reward ratios. On today’s article we will go a step further and explore the effect of adding a trend following component to random traders in order to bias their trading decisions towards long or short trades depending on recent market directionality. We will then compare the results of these traders with those of traders who are completely random traders (regarding both timing and long/short symmetry), by observing the differences between both groups we will be able to see the effects of a trend following component and see whether this gives a positive/negative or neutral effect to our overall trading results. Using this information it will be simple to assess whether the usual “follow the trend” advice, makes sense on the EUR/USD in the Forex market.
–

–
In order to carry out the above experiment I have done two separate random outcome generation runs in which I have simulated 25,000 outcomes across both trend following and non-trend following traders. Simulations were carried out on EUR/USD 1H data from 2000 to 2014 using a 3 pip spread. In both groups the risk to reward ratio was set at 1:1 (100 pips TP/SL) and in both cases the 25,000 runs were repeated twice in order to ensure that results were convergent. Every trader had a 10% probability to enter a trade on a new 1H bar if no trades were currently open. For the trend-followers entries were restricted to longs if the difference between the current bar and the bar 48 in the past was positive and to shorts if the difference was negative. This means that the trend following group could only enter long trades if the past two days had been bullish and short trades if the past two days had been bearish. The non-trend following group decided randomly between a short and long trade on entry.
The results are clearly different between both groups. The first initial and obvious difference relates to the number of long/short trades. As we would expect, the average number of trades is almost identical across both groups (around 1600 trades) given the fact that their entry probability is exactly the same (the number of average trades is slightly smaller on the fully random group because a larger number of accounts go bankrupt and end trading before the 14 year period ends). However the number of long/short trades across both groups is clearly different, since the trend-following bias causes a split of long/short trading frequencies that is not seen on purely random traders, since the frequency of up and down trending markets (per the definition given) is not exactly symmetrical through the past 14 years. You can see very similar overlapping distributions on the random trading group while the trend followers have two clearly split and rather narrow distributions for long and short trades.
–
–
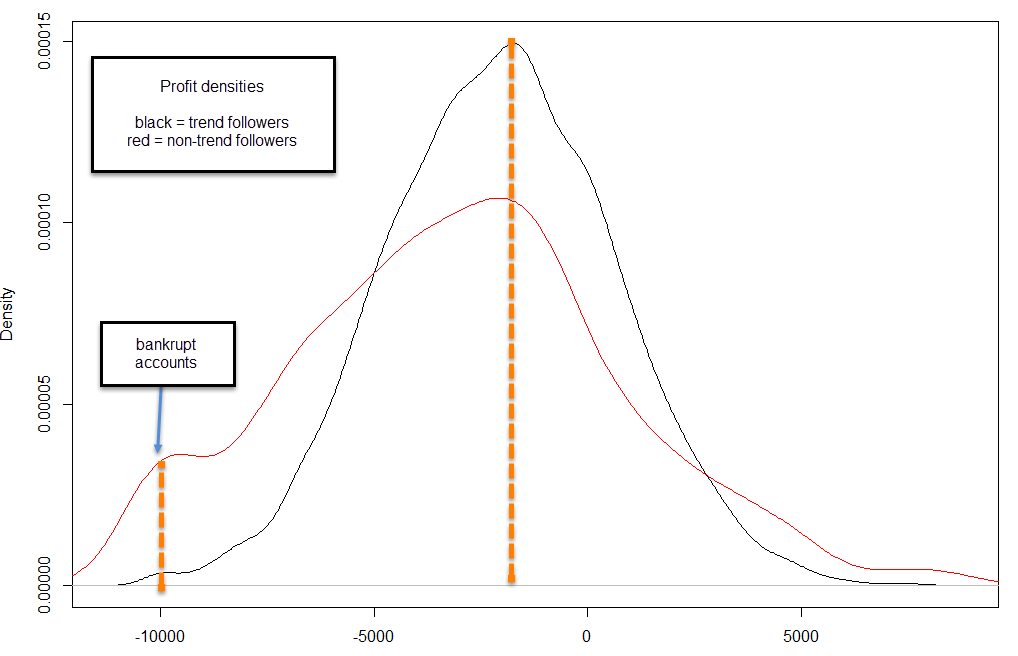
Perhaps the most interesting results relate to the density of the profit plots across both tests. In the trend following group there is a clear and lower population across the lower end of the spectrum (worst losers) with an also lower population across the far end of the profitable spectrum (best winners). The distributions have an identical center at negative territory but the trend follower distribution has a much higher highest frequency and falls much more sharply. The consequence is mainly that mild losing/winning scenarios are much more frequent for trend followers while very large winners and losers are much more infrequent. It is rather interesting to compare the mean values of both distributions which show the overall expected profit levels for the two trading groups. The trend following distribution is actually significantly more skewed towards positive territory and this ends up shifting the mean to -2050 pips while the mean for the random trading group is -3011 pips. This means that the trend following group has an overall lower decay towards the negatively biased random walk scenario, meaning that it in fact is able to decay at a lower phase than that dictated by the spread (a tendency to lose money slower than random chance).
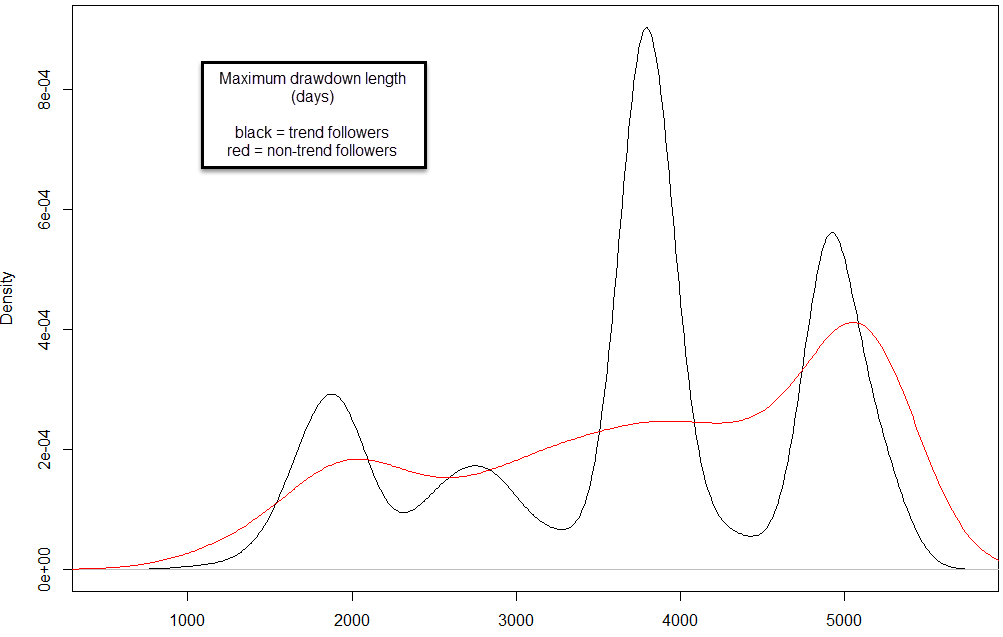
A very intriguing picture is also drawn by the maximum drawdown length density plots. While the random scenario shows a rather smooth curve that grows steadily towards a maximum near the length of the testing period (13.7 years) the trend following group has 4 sharp and well defined peaks, with the highest peak located near 3500 days. This is rather intriguing as it shows that the most frequent scenario is not the scenario expected from a pure negatively biased random walk (which is exactly what is obtained for the pure random traders) but a scenario at a lower maximum drawdown length that indicates some unavoidable profitable periods through the test thanks to the tendency to follow the overall trend from the EUR/USD. This suggests that the trend following component adds a substantially positive effect to the overall outcome of random traders, something confirmed by the profit density plots showed before.
–
–
Overall we can say that “following the trend” – in the manner defined within this study – clearly confers an advantage over purely random trading, which we can see as a tendency to decay slower towards bankruptcy. Although this advantage is not enough to overcome the effect of the spread, as we merely reduce the negative bias, it does show that trend following does cause important differences in the expected outcomes for groups of random traders. This may very well explain the behavior of trend-following traders as a group, as traders who consider themselves trend followers may not enter the market in any correlated manner besides that given by recent market directionality. This study opens up many questions regarding trend following behavior, for example how it may affect random trader populations across other symbols, what the effect of other “trend following” definitions would be and whether changing the risk to reward ratio will have a profound effect on overall results.
If you would like to learn more about the market and how you too can build your own algorithmic trading systems please consider joining Asirikuy.com, a website filled with educational videos, trading systems, development and a sound, honest and transparent approach towards automated trading in general . I hope you enjoyed this article ! :o)


Hi Daniel,
Did you try this for the contrarian strategy (profiting from reversion to the mean)? It would be interesting to see which of the two common approaches, trend-following vs contrarian, would fare best.
Sam
Hi Sam,
Thanks for writing :o) That would indeed be interesting, especially across several different symbols. I’ll work on a post about this soon! Always great to read your comments,
Best regards,
Daniel