Alternative representations of financial time series have generated a lot of attention during the past few years. You will find many different forums and magazine articles that suggest traders switch to constant range or volume charts in order to get a “clearer picture” of the market and make trading decisions with higher levels of precision. However the construction of these charts is not trivial and it becomes obvious – when building automated trading system implementations using them – that the simple act of using these charts carries within its core a lot of problematic assumptions that make them potentially worse than the traditional financial time series we all traditionally use. So what are these problems? How can they be overcome? On today’s post I will strive to answer these questions and tell you why these charts are not the bees knees. In particular I will use renko charts to exemplify my points (but these applies to all similar chart types).
–

–
So what are these renko charts? Renko charts are series where bars are not formed as a function of time but as a function of a given trading range. A ten pip renko chart draws a new bar when price moves a set number of pips in a given direction above the open or close of the last renko bar and therefore the representation is time-independent in the sense that the renko chart does not care if it takes 1 hour or 1 day to move that distance, it just cares whether this distance is achieved or not. But are renko charts truly time-independent? It is fallacious in essence to say that data derived from a time-dependent measurement is time independent, that simply cannot happen. Let me show you why.
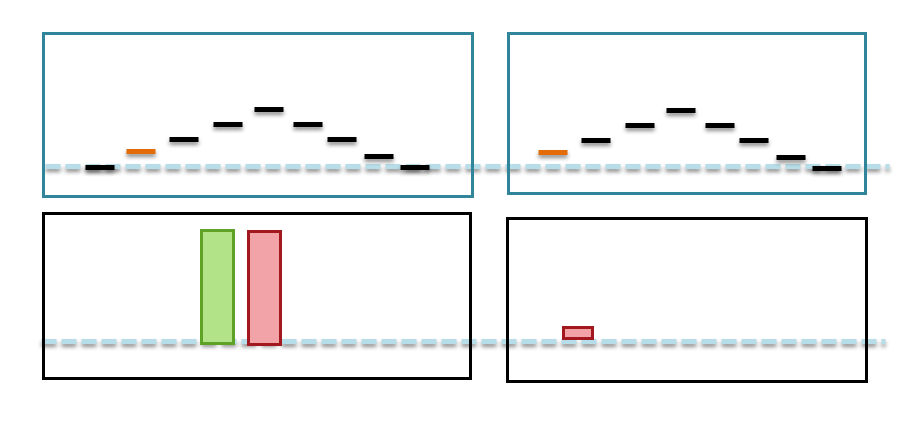
The time dependence of a renko chart is hidden within its construction. Renko charts are constructed from ticks (if constructed correctly, although high resolution bars can be used as an approximation) and how you take these ticks into consideration for chart construction can make a huge difference. Suppose we have a chart where all ticks are equal to 1 pip and we want to construct a 5 pip renko chart. You can see on the image above two different cases for chart construction, in the first we have that the renko chart (bottom left) is constructed using the 10 ticks available while on the second chart (bottom right) the renko chart is constructed using only 9 ticks. The outcome is dramatically different between both scenarios. On one hand you have two full 5 pip bars while in the other case you just have a 1 pip negative bar from the entry.
This means the origin selected for the renko bar construction can dramatically change the entire makeup of a renko chart. Start constructing your chart one tick later and your entire 10, 20 or 30+ year chart can look completely different. This is because the renko chart is in reality time dependent, it shows price evolution from a fixed point in time, the illusion of price independence comes with a very expensive origin assumption. How many possible origins are available? As many as you have ticks within the instrument’s history. Which one is correct? They all are correct (picking anyone generates an incredible amount of data-mining bias). How can you create a system if the origin point dramatically changes the way in which the chart is built and therefore changes all chart derived signals? Well I’m glad you asked that question.
–
–
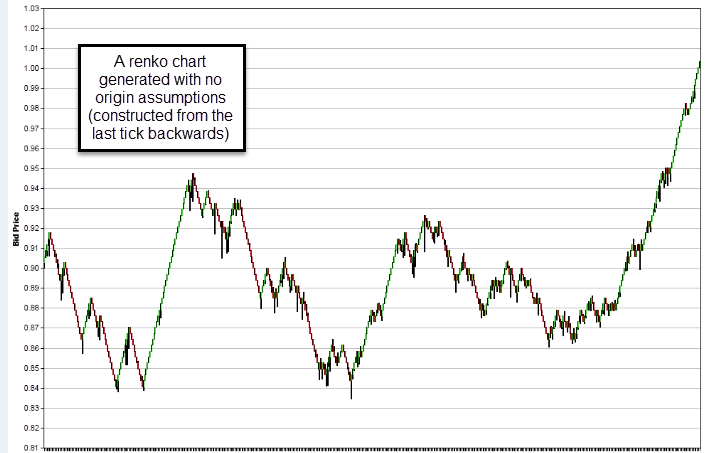
The only way to eliminate origin dependence in renko charts is to eliminate origin assumptions altogether and simply rebuild the chart from the last available tick backwards on each new tick (building forward is never an option because this makes an assumption about history length, an origin issue). This means that the entire renko chart must be recreated after each tick and signals must be read from this new, constantly evolving chart that changes increasingly as a function of a tick. This also means that whether you’re on an old or new bar is difficult to say because you are drawing the chart backwards and you are – by definition – always within a bar that is being drawn. This makes system construction difficult because it is computationally much more demanding and in human terms much more difficult to interpret since the chart repaints on each new tick (which is the reality of a renko chart).
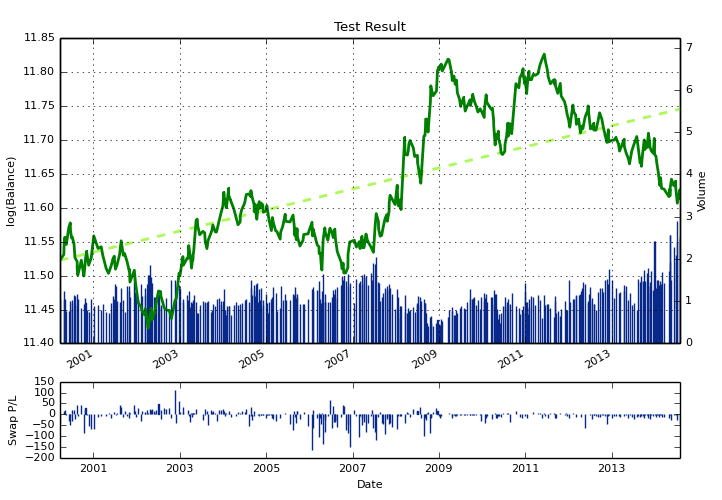
Our system programming framework at Asirikuy implements this mechanism for renko chart construction and allows for building of renko charts and the trading of systems based on signals derived from this construction mechanism without any origin assumptions. Since renko charts are reconstructed on each new tick we can even create cool things, like renko charts constructed from a multiple of the ATR instead of a fixed bar range, this further eliminates the other construction assumption (the range) and makes it entirely dynamic for system trading. Take for example the following system, it builds a renko chart on each tick using a size equal to the 10-day ATR and then opens a long on three consecutive bullish bars or a short on three consecutive bearish bars. It updates the SL/TP if a signal is repeated and closes/reverses when we have a signal in a different direction. The system uses an SL/TP of 100% of the ATR. Below you can see the F4 system code and above a chart generated by the F4 framework for a sample entry (you can see how the last 3 bars are in fact bullish bars). You can also see the EUR/USD back-testing results (2001-2013) for this toy example.
–
#include "Precompiled.h"
#include "AsirikuyStrategies.h"
#include "EasyTradeCWrapper.hpp"
#include "AsirikuyImageProcessorCWrapper.hpp"

#define RENKO_CHART_INDEX 2

AsirikuyReturnCode runTestEA(StrategyParams* pParams)
{

 double stopLoss;
 double takeProfit;
 double atr;

 atr = iAtr(DAILY_RATES, 5, 1);
 stopLoss = atr;
 takeProfit = atr;

 addNewRenkoRates(PRIMARY_RATES,RENKO_CHART_INDEX,atr);

 if (iOpen(RENKO_CHART_INDEX,0) > iOpen(RENKO_CHART_INDEX,1) &&
 iOpen(RENKO_CHART_INDEX,1) > iOpen(RENKO_CHART_INDEX,2) &&
 iOpen(RENKO_CHART_INDEX,2) > iOpen(RENKO_CHART_INDEX,3)){
 return openOrUpdateLongEasy(takeProfit, stopLoss);
 }

 if (iOpen(RENKO_CHART_INDEX,0) < iOpen(RENKO_CHART_INDEX,1) &&
 iOpen(RENKO_CHART_INDEX,1) < iOpen(RENKO_CHART_INDEX,2) &&
 iOpen(RENKO_CHART_INDEX,2) < iOpen(RENKO_CHART_INDEX,3)){
 return openOrUpdateShortEasy(takeProfit, stopLoss);
 }

 return SUCCESS;
}
–
–
If you would like to learn more about our programming framework and how you too can create and back-test strategies using renko charts please consider joining Asirikuy.com, a website filled with educational videos, trading systems, development and a sound, honest and transparent approach towards automated trading.


