If you want to build trading systems that come from low data-mining bias (DMB) processes but you lack the necessary computational power or knowledge to perform a proper DMB assessment then your best bet is to generate systems that come from a multitude of different data series. As we saw on my post for building a multi-currency portfolio using OpenKantu the more series you use the lower the overall DMB of your process will be. Today we are going to discuss another strategy for the reduction of mining-bias using not information from different symbols but information from different timeframes. On this post we will be talking about building strategies that work across multiple timeframes on the same symbol.
–


–
Certainly using different symbols to generate strategies is a good way to reduce DMB and a good way to create strategies that tackle very global market inefficiencies. However if we want to explore the particular character of a given symbol to allow you to profit from its particular behavior then you are definitely unable to use data from different symbols to reduce the DMB of your mining process. The solution that you have is to generate a system that is able to profit from different data derivations from the same symbol’s tick data, meaning you need to find systems that work across a multitude of timeframes at the same time. This porcess will allow you to reduce your DMB although by a much lesser amount than when using multiple symbols since the data from a single symbol is inevitably and strongly correlated (because the source, the tick data, is in the end the same).
When you do this type of multi-timeframe mining it is often useful to take different timeframes that have completely different characteristics. For example the daily timeframe does not suffer from periodic volatility as its scope is too broad for market closing and opening times to cause noticeable cycles within it while timeframes below the daily are susceptible to this phenomenon. If you mine a system that works on the daily and the hourly you will effectively have found a behavior that is independent of volatility cycles and shows some general characteristic of trader behavior within this symbol (if we assume that the inefficiency found is real). Another thing to consider is that the reduction in DMB from using additional timeframes is not large so you will want to keep your mining complexity low if you want to keep your overall process DMB low as well. If you increase complexity to allow you to find systems on multiple timeframes then that increase in complexity may eliminate all the advantage that you have for the addition of a new timeframe.
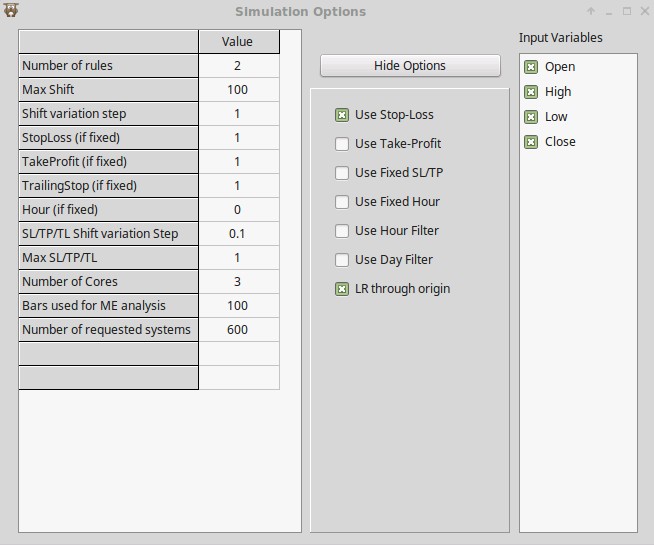
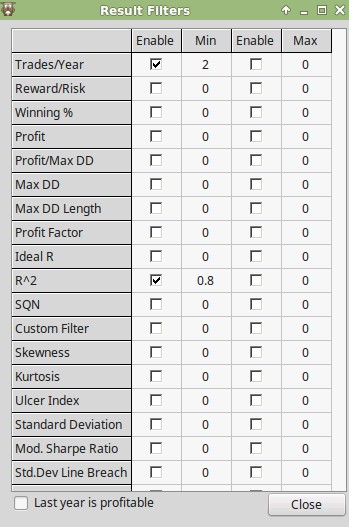
For the example I am going to show you I chose the mining configuration that you can see above. I chose a low complexity for the mining process (max 2 rules with a 100 candle shift with a maximum stop loss of 1) and I chose a simple frequency and R² filter of 0.80 (notice how I checked the LR through origin box as well). This mining process carried out on the EUR/USD daily and hourly has a low mining bias (which I measured through the use of pKantu, our GPU based mining software at Asirikuy). You can then perform the mining by simply loading your EUR/USD 1D and 1H data – make sure both data sets are from the same source – and selecting the Find Systems -> multiple symbol menu option.
–


–
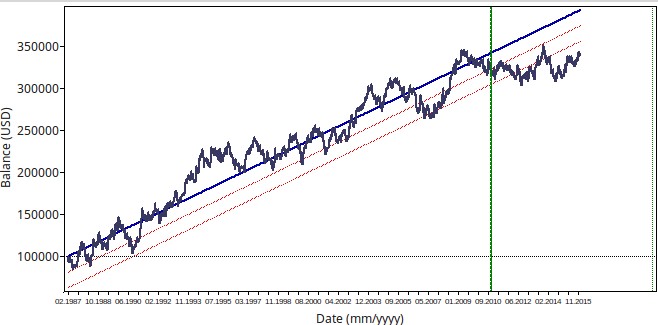
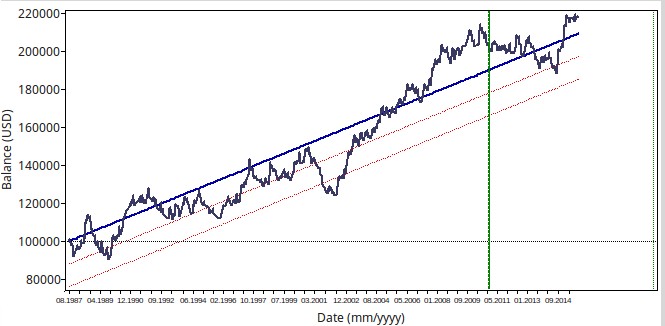
Above you can see an example for the systems generated (top 1H, bottom 1D). The system is highly linear in 1988-2010 data using the exact same configuration on both symbols, proving that it is able to find some behavior that transcends the barrier between both timeframes. Out of the mining period both systems have profitable results although the daily system has a significantly better performance which is often the case. You can also see that results are also not as correlated as we would expect (R between both systems is below 0.5) which shows that although both systems use the same pattern the frequency of these pattern varies greatly between both timeframes.
It is important to notice that the 1H system trades much more often than the 1D system so if you wanted to trade both of these systems together you would seek to equalize their net exposure by making the 1D strategy risk more money than the 1H strategy per trade. If the 1H strategy has 5x more trades then the 1H strategy should be taking 1/5 the risk of the 1D strategy such that their exposure with time is the same.
The above exercise can be extended to lower timeframes if you desire although the lower you go the harder it will be to find systems that work on all timeframes. You might want to try the 1D/4H/1H combo which gives a good flow between a timeframe that has completely independence from periodic volatility (1D) and a timeframe that has a completely cyclic volatility behavior (1H). I would advice against going far lower because it will be very hard to find patterns and the great increase in complexity you’ll need to make will probably imply that all your strategies will come from spurious correlations. As always you need to thread very carefully if you can’t measure the mining bias of your strategy searching process.
If you would like to learn more about mining trading strategies and how you can use the power of GPU technology to mine potentially billions of systems each day and have a robust method to account for the data-mining bias of your system searching process please consider joining Asirikuy.com, a website filled with educational videos, trading systems, development and a sound, honest and transparent approach towards automated trading.


Hi Daniel,
thanks for the informative post, but can you explain a bit more detailed what advantage the “LR through origin” brings in your case? I have been struggling to make any use out of it throughout the years and most of the time am happy with the R^2 to judge strategies, along with a combination of max DD length, ret/dd ratio and of course DMB.
Thanks:)
Hi Geektrader,
Thanks for writing. The “LR Through Origin” forces the linear regression to go through the origin so it forces it to be of the form F(x) = mx instead of F(x) = mx + b. Since an ideal trading system should start it’s equity curve at 0 profit making it cross the origin establishes a more faithful model to follow rather than an arbitrary linear regression. An R² of a model going through the origin often leads to better selections due to this reason and you will find it much harder to find high R² values because of the more restricted degrees of freedom of the function. I always use this when creating systems. Let me know if you have other questions,
Best Regards,
Daniel
Hi Daniel,
I was wondering this too.
Is there any empirical evidence that forcing the intercept to zero leads to better system candidate selection?
Furthermore, several discussions about this seem to conclude that the intercept should be included even if you know that f(0)=0 for various reasons, and this paper / https://online.stat.psu.edu/~ajw13/stat501/SpecialTopics/Reg_thru_origin.pdf / states that R² might not even be an appropriate measure for Regression through the origin.
It would be great if you could further elaborate your reasoning and share your thoughts about this.
Kind Regards
Hi Daniel,
thanks for letting me know and good to know the function is there:)
Another question: I am currently trading some OpenKantu systems in MT4 and all 4 strategies that I trade currently have trades open. Now I want to change the risk a bit, will it be a problem and will it get out of sync since the EA gets re-initialized while trades are open and lot-size for following trades is changed? I think you mentioned that it is no problem as the EA sees it own trades by magic number, but just wanted to make sure before looking through the whole code;)
Thank you,
Lorenz
Hi Lorenz,
There should be no problem if you make this change and restart the systems. They manage trades by magic number so it won’t make any difference in the management of the currently open trades. Thanks for writing,
Best Regards,
Daniel
Hi Daniel,
First of all thanks for sharing the software, it is really helpful.
I have a couple of questions:
1) I just read the manual and it says that it can also generate strategies using bar range and body but I could not find these features on the platform. How can I use them?
2)Is there any way to use inputs other than OHLC?
Regards,
Braulio.
Hi Braulio,
Thanks for writing. Let me answer your questions:
1. These were removed, there are some issues with their use.
2. No, only OHLC values can be used.
Let me know if you have other questions,
Best Regards,
Daniel
Hi Daniel,
What about considering trying to find strategies that work to more than one ccy pair? Wouldnt this mean that there is even lower data mining bias?
D
Yes of course, that helps. You can read my post about examples using multiple pairs here: http://mechanicalforex.com/2015/11/using-openkantu-in-practice-creating-a-market-wide-forex-system-portfolio.html.