Classifying trading systems using their statistical properties is a very important task. It is how we decide to trade one system over another and how we determine the level of risk that comes from trading a given strategy. The selection of which statistics to use to compare trading strategies is therefore vital to the process of trading system evaluation and design as many decisions will come from comparing these values. On today’s post I will be talking about one of the most widely used values in trading system statistics – the maximum drawdown – and why it is in reality a very poor statistic to use for both the projection of future risk and the comparison of different trading strategies. We will look at how it is calculated, what this implies and how it should in reality be calculated if you wanted it to be a useful measure. We will also go briefly into some other risk statistics and why they are much better than the maximum drawdown.
–


–
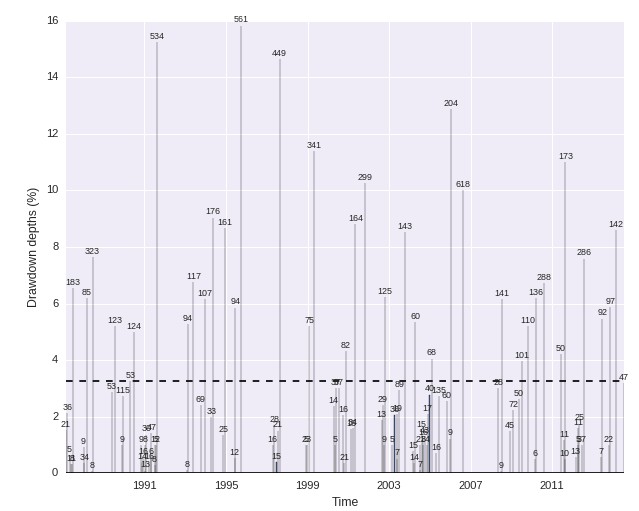
Before talking about maximum drawdown we should first talk about what a drawdown is. A drawdown constitutes the maximum drop that happens between two consecutive equity highs. It therefore measures an extreme case between two points in an equity curve that are not constrained to any defined time lapse. Due to this reason a drawdown may last the entire length of a trading system’s back-test or just a small fraction of it. The underwater and full drawdown plots shown above depict all the drawdown periods of a sample strategy. You can see there that some drawdown periods are very short lasting while others are very long lasting. The maximum drawdown – which is the deepest period from all the drawdown periods – lasts 561 days and has a depth of around 16%. However this is not the longest period – which is 618 days and happens around 2007 – so the drawdown depth and length are indeed independent statistics.
The above graphs already show some of the problems with this measurement. Drawdowns in themselves are extreme statistics – the largest drops between two points – and the maximum drawdown is indeed a worst extreme, it is the biggest drop from all the drops. It is a single point in an entire time series and therefore it carries with it all the problem inherent to being a unique statistical measurement. This fact makes it an extremely sensible statistic: a system with a much higher average drawdown period depth might simply have gotten lucky and avoided hitting a maximum drawdown greater than that of a strategy with a much lower average drawdown period. Often differences in just a few trades may mark the difference between one strategy having a lower or higher max drawdown statistic relative to another.
–

–
Can we fix this measurement? The average drawdown period length might seem like a suitable replacement but it sadly does not capture the very nature of the statistic we are trying to get which is an expected worst case for a trading strategy. An average drawdown period length gives a better way to compare strategies relative to their average risk and – like the Sharpe ratio – gives us a better way to compare systems than looking at an extreme statistic. However there are ways in which we can modify the maximum drawdown calculation to make it more reliable, although at the cost of much higher complexity.
To fix the maximum drawdown we need to obtain multiple values for it using proxies for the equity curve we have at hand in order to eliminate the errors associated with the random distribution of trades for the trading strategy. This means that to have a better maximum drawdown statistic we need to carry out Monte Carlo simulations of a trading strategy using its distribution of returns so that we can have thousands of maximum drawdown measurements that we can use to derive cases based on probability. Using this information we can then get an expected maximum drawdown statistic at a given confidence interval which would suppose a real statistical worst case for a trading system. This new maximum drawdown statistic is therefore a much better proxy for real risk, subject to much lower estimation errors and can be used in a much more trustworthy manner to compare extreme behavior between systems.
–

–
There are however some very important things that must be taken into account when using Monte Carlo simulations for this purpose. The simulations must reproduce the exact money management strategy used by the trading system being evaluated and the system’s daily equity return distribution must be used instead of the per-trade distribution. In this manner the real maximum drawdown for grid and martingales will indeed show to be 100%, as we would expect for these cases where there is an uncapped risk exposure. While the analysis of a single back-test might make a martingale or a grid seem like reasonable strategy a true Monte Carlo analysis will always reveal total loss, no matter how good the trading strategy look in back-tests simply because the Monte Carlo simulation reveals the true nature of the lack of proper risk limits within the strategy.
There are a few additional sources that you might be interested in if you want to learn more about the problems with the maximum drawdown and how you can improve on its calculation. I would recommend these articles: here, here, here and here, that go a bit deeper into the problem and suggest some additional potential solutions. However the conclusion is always that a reliable extreme measurement needs to be derived from something like a Monte Carlo simulation where you have a multitude of equity curves to calculate the measurement rather than from a single equity curve which is exposed to a wide error in the estimation of the statistic.
I generally don’t use the normal maximum drawdown or Monte Carlo derived maximum drawdown statistics for the comparison of trading systems or the determination of worst cases since there are more powerful tools that are available to both select and discard trading systems (at much earlier points than a monte carlo worst case would predict). If you would like to learn more about how to compare systems or decide when a system should stop trading using statistically based criteria please consider joining Asirikuy.com, a website filled with educational videos, trading systems, development and a sound, honest and transparent approach towards automated trading.


