Monte Carlos (MC) simulations are tremendously useful for the exploration and description of trading systems. As I said on a recent post they allow for extending the calculation of extreme statistics, such as the maximum drawdown, in order to obtain values that are far more useful than single values derived from the the system’s back-testing results on the real data. Furthermore Monte Carlo simulations allow for the creation of statistics within a specific confidence interval allowing you to evaluate a trading strategy against a worst case scenario and discard it if it falls outside of this threshold. Today I am going to talk about how you can perform these simulations using the qq-pat library, how to interpret the results and what requirements your strategy needs to fulfill for these results to make sense.
–
import pandas as pd
import datetime
import qqpat

data = pd.read_csv('returnsFile.csv', header = None, index_col=0, parse_dates=True)
analyzer = qqpat.Analizer(data, column_type='return')

print "Monte carlo statistics using 100 simulations for the first symbol"
print analyzer.get_mc_statistics(index=0, iterations=100, confidence=99)

analyzer.plot_mc_distributions(index=0, iterations=100)
analyzer.plot_mc_simulations(index=0, iterations=100)
–
In a Monte Carlo simulation we take the distribution of returns of a trading system and then create a new series where we generate returns randomly following the same overall frequency distribution as in the original return series. In the end you have a series that has a closely matching distribution of returns compared to the original but where returns are distributed along the equity curve in a different manner. If you perform hundreds of these simulations you end up with a general view of all potential equity curves that could match that distribution of returns. If you take a given percentile of some statistic you can then derive worst case that you can use to discard a strategy. Say if the 99th percentile maximum drawdown of 1000 Monte Carlo simulations is 40% you can then discard your strategy with a 99% confidence if it falls below the 40% drawdown level because you know that for that distribution of returns the probability that you reach that drawdown is below 1%.
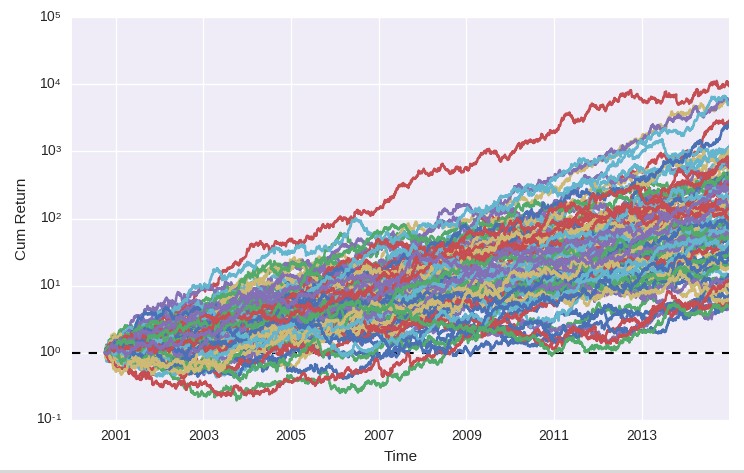
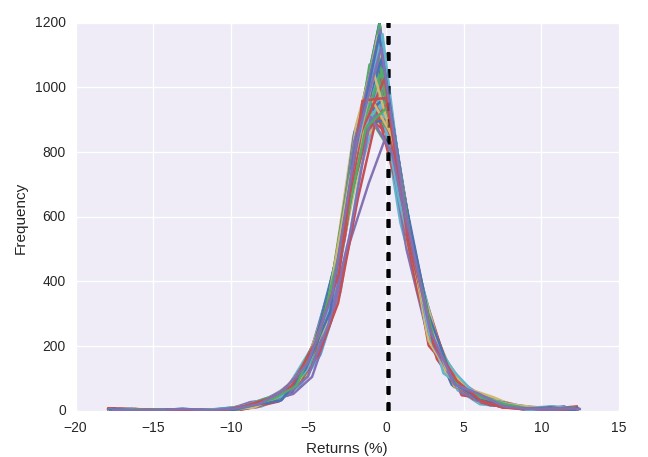
If you define a pandas dataframe with your strategy returns or balance changes (in the above example I loaded the data from a csv containing a date and a return column, if you have balance changes instead you can change the column type to “price”) you can then use qq-pat to carry out MC simulations of your trading strategy, obtain simulation and distribution curves as well as the statistics at a 99% confidence interval. In this example I carried out the MC simulations using 100 iterations – which means I created 100 curves for analysis with the same overall distribution of returns – which generated the plots that you can see below. If you want to analyze your MT4 results in this manner remember that you can get your MT4 reports into a pandas dataframe by following the code I have posted on a previous tutorial. Although on that tutorial we used pyfolio the same pandas dataframe can be used as an input to qq-pat.
–


–
As you can see on the plots above the MC iterations all have results that are quite similar in terms of their distribution of returns. The distribution of returns of the individual MC runs are all of a similar average (the black dotted vertical lines) and the distributions are very similarly looking. Of course the distributions are not all identical – because you have some random variations in the MC simulation process – but they are all in good agreement with the original distribution of returns. If you performed a hypothesis test to see if they are from a different distribution you wouldn’t be able to negate the null hypothesis. the statistical results do however reveal a wide distribution of drawdown values with the 99% result at around 60%. This means that if this strategy was live traded and it reached that point we could discard it with a 99% confidence.
I would also like to point out that there are some important restrictions to which systems you can use within the procedure implemented in qq-pat and obtain reliable results. This simulator does not account for any type of serial dependence in your returns so if the results of a trade are in any way related to the outcome of the next trade then the results will not make sense and might seriously underestimate risk. For example if you tested a martingale it would seriously underestimate risk because it does not know that there is an exponential dependence between the magnitude of a loss and where that loss is in a series of losing trades. This also discards any strategy that shows any type of serial auto-correlation. Strategies that use pyramiding or that have the opening/closing of trades depend on previous positions cannot be accurately evaluated using this type of MC procedure. However any type of well-behaved non-serially correlated strategy can use this simulator for the evaluation of extreme statistics.
–

–
It is also worth mentioning that MC simulations might give you different WC at different numbers of trades. This is because the speed with which a drawdown is reached is just as important as the drawdown’s depth. So for example while you might have a worst case of 40% for a 10 year run it might be that a 10% loss within a short period will already constitute a reason to discard a strategy, because in general that loss is expected to happen across months and not days/weeks. The most powerful use of MC simulations comes when you constantly evaluate your worst case for the exact number of days you have been trading and constantly regenerate and compare to see if you have fallen below any worst case threshold. This is something you can easily do and automate using qq-pat since this open source library allows you to easily perform these tests using python.
If you would like to learn about other methodologies to draw statistical worst cases and how you too can learn to create a complete algorithmic trading methodology please consider joining Asirikuy.com, a website filled with educational videos, trading systems, development and a sound, honest and transparent approach towards automated trading.


