It was June 2014 when our data mining bias (DMB) evaluation methodology in conjunction with our GPU mining software (pKantu) started to generate our first price action based systems. With the start of our trading repository a methodology based on the automated mining of trading strategies through the use of low DMB processes was established and with this and the power and collaboration within our community – using cloud mining – we started to gather a very significant number of trading strategies. After one and a half years of this process and the accumulation of thousands of strategies it is relevant to ask ourselves how this process has gone and where it will take us going forward. On today’s post we are going to take a look at how this methodology has performed for us through time and specially how it relates to other market instruments, mainly the SPY (an ETF that tracks the S&P500) and TLT (a long term US bond ETF).
–

–
I want to take some time first to describe our generation methodology. We use pKantu to evaluate mining spaces that are in the 100-500 million candidate system range, pre-selecting systems with high stability (R² > 0.95) and other similarly desirable characteristics. We then repeat this process on random time series created using bootstrapping with replacement of the original series – as many times as needed for convergence on random series results – in order to evaluate the data mining bias of the generation process (see the link above about DMB). If a process has a low DMB we then select systems with a Sharpe ratio above 0.7 and compare their correlation with all systems currently in the repository. If a system has a correlation below 0.5 with all systems currently being traded we then add that system to the repository. We also constantly evaluate added systems against two statistically defined worst case scenarios and any systems that breach those scenarios are permanently removed from trading.
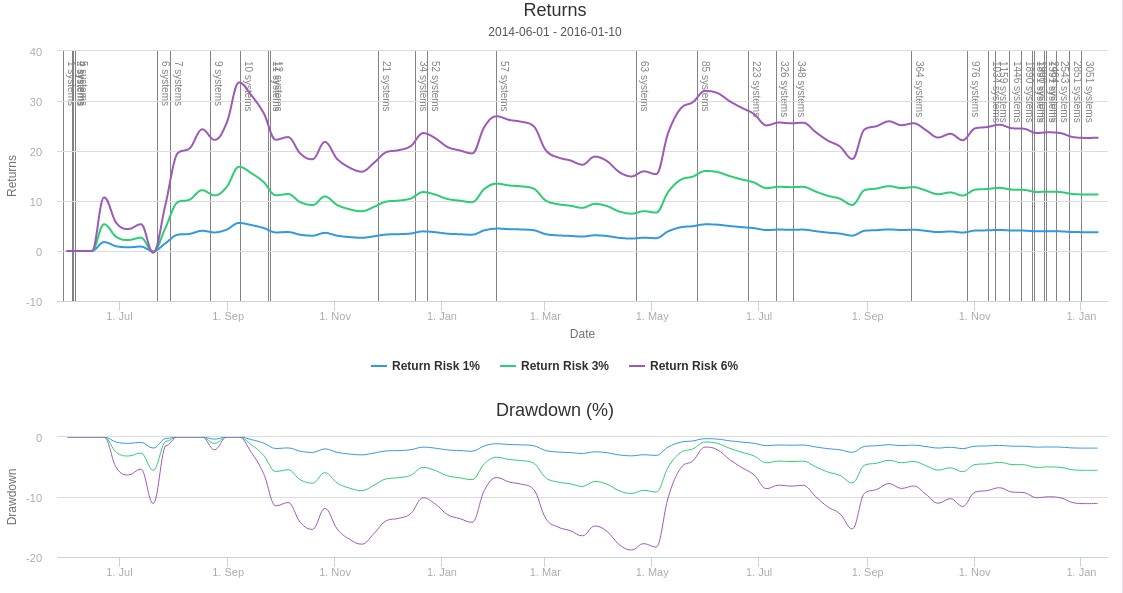
Of course there is no guarantee that the above process would work so it is important to evaluate how the process actually performs to see if it has actually yielded a positive result outside of the mining period for the strategies. The above graph shows you the results of the above mentioned methodology since its inception for 3 different total portfolio risk levels. At each point the sum of the risk of all systems is therefore equal to 1%, 3% or 6% depending on the mentioned case (all systems are weight equally). You can also see vertical lines representing the number of systems present within the portfolio at each point in time. Initially our mining was much slower since it was done by only a few people and coordination was quite low while later on the automation of the entire system evaluation and addition process generated a dramatic speedup in system addition. As you can see we went from 1 system in June 2014 to 3051 systems currently being traded within the repository.
–


–
The results after 1.5 years have been quite positive overall with all the statistics firmly within what is expected from the realm of potential statistics within the 28 year back-tests of the portfolios at each different point in time. We would however expect the Sharpe ratio to improve towards a higher value as time progresses, particularly due to both the addition of more systems and the convergence towards the long term back-testing case statistic. Even if there is some deterioration of the long term Sharpe from its back-testing value we would expect it to fall above at least 2.0 in the long term. System failure has also been quite within expectations with less than 1% of systems reaching their worst case scenario within 1.5 years in good agreement with what is expected from the DMB procedure. Although all systems are doomed to eventually fail we expect them to function for a long enough period as to give significant positive returns, something we have been able to observe up until now.
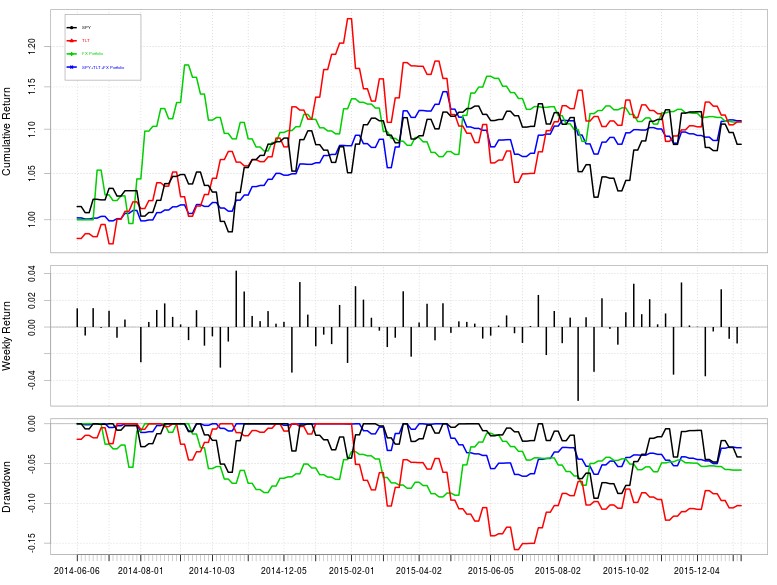
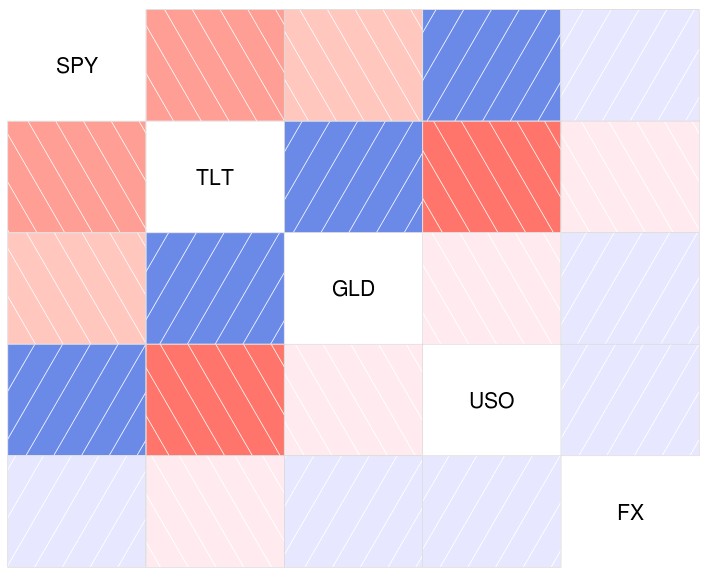
I would also like to draw your attention to the second plot above which shows the 3% total risk equal weight portfolio against the SPY and TLT financial instruments. This FX portfolio out-performed both instruments in terms of total return, risk and risk adjusted return. Another very important point is that the FX portfolio holds a very low correlation with both the SPY and TLT (R values of -0.047 and -0.12) which is extremely valuable to an investor as it provides a clear hedge to both the bond and stock capital markets. As the graph below shows the correlation with USO and GLD is also very low (darker colors imply more strongly negative (red) or positive (blue) correlations). Not surprisingly the FX+TLT+SPY equally weight portfolio achieves a better performance than either of the three instruments as it is able to take advantage of the great hedge happening between the FX mining based portfolio, stocks and bonds. Note that the TLT and SPY curves also include dividends.
–

–
It is also worth noting that the results of the method are also only hoped to improve with time. As more systems have been added to the repository we have seen return volatility drop, in particular downside volatility has become much less pronounced. In effect as the number of systems within the portfolio increases we expect to see a smoothing of the equity curve such that drawdown periods become essentially flat – very slowly down-slopping smooth periods – while winning periods become characterized by rapid increases in account equity as a large number of systems enter winning situations. As other improvements are made to the mining process – such as with the addition of new pairs or new trailing stop mechanisms – we also hope results to improve even further. can you buy Clomiphene over the counter in south africa For me the results above point to a very clear statement: our GPU based data mining process works.
If you want to learn more about our portfolio trading methodologies and how you too can trade thousands of strategies at the same time on a retail Forex account at controlled risk levels please consider joining Asirikuy.com, a website filled with educational videos, trading systems, development and a sound, honest and transparent approach towards automated trading.


