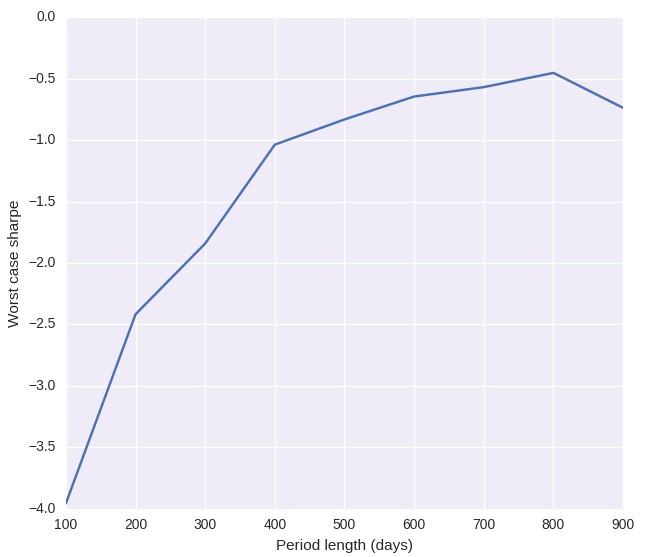
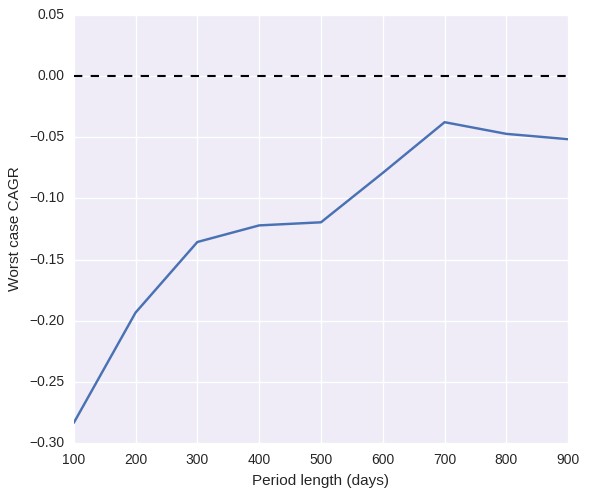
Since the release of the qq-pat library for the easy analysis of financial time series in python I have created several functions for the evaluation of system failure within it using Monte Carlo simulations. I first implemented functions to perform basic exercises such as the creation of all-time system MC simulations, the plotting of MC curves and distributions and the calculation and plotting of worst case statistics as a function of trading period length. From my last post – where I talk about how to update MC simulations to draw continuous worst case estimations for a system within a given drawdown period – I have created new functions and modified functions within the qq-pat library in order to allow for the easy detection of worst case scenarios for any given financial daily return series. On this post I am going to show you how you can use qq-pat for this effect and what the function does in general. You can download sample code and system return file to reproduce everything showed below here. Please bear in mind that to use all the information contained herein your need to have qqpat >= v1.505 installed within your computer, lower versions will not contain the functions described and other functions might still suffer from significant bugs.
–
import pandas as pd
from pandas_datareader import data
import datetime
import qqpat
import csv

def lastValue(x):
    try:
        reply = x[-1]
    except:
        reply = None
    return reply

tradeTimes = []
tradeBalance = []

with open("sample_sys.txt", 'rb') as csvfile:
        reader = csv.reader(csvfile)
        i = 0
        lastBalance = 100000
        for row in reader:
            if i > 0:
                tradeTimes.append(datetime.datetime.strptime(row[3], '%d/%m/%Y %H:%M'))
                tradeBalance.append(float(row[10]))
            i += 1

data = pd.DataFrame(data=tradeBalance, index=tradeTimes).resample('D', how=lastValue).pct_change(fill_method='pad').fillna(0)

analyzer = qqpat.Analizer(data, column_type='return', titles=["sys"])

# get worst case values and statistics for current drawdown period
print analyzer.get_mc_statistics_for_current_dd(iterations=200, confidence=99)

# plot worst case statistics for different trading period lengths
analyzer.plot_mc_wc_evolution_sharpe(iterations=200)
analyzer.plot_mc_wc_evolution_cagr(iterations=200)
–
In reality when we talk about worst case detection for a trading system we want this detection to be as automatic and as fast as possible. Although my last post provided some guidelines into how to perform worst case analysis the things that need to be done are still cumbersome and quite difficult to achieve for most people. Having to look into whether we are in the last drawdown period, searching for the last equity high, calculating a Monte Carlo simulation using only data before this period, calculating the worst case statistics at a given confidence interval and then making a comparison to judge whether we are below those statistics – which means calculate both the worst case thresholds and the statistics within the current drawdown period – is a probably long process prone to a lot of mistakes if being done by someone without experience in this type of simulations.
My idea was to make this process a lot easier for the average user using the qq-pat library. I have now implemented a new function called get_mc_statistics_for_current_dd which automates the above process and makes it extremely easy for anyone who wants to calculate whether a system in it’s present drawdown is below it’s worst case Monte Carlo statistics within a given confidence interval. While performing this process I also fixed several bugs within the Monte Carlo simulations in the library, simplified the simulation code and changed the Monte Carlo simulation code such that data used for simulations never includes data up from the last equity high (the current drawdown period). This all fits within the things I mentioned in my last post and makes the MC simulations a great tool for the continuous evaluation of worst cases.
–

–
All you need to do now to know whether your strategy is breaching a Monte Carlo derived worst case statistic is to load your daily system returns – results from the beginning of your back-test to present – into the qq-pat library and then call the get_mc_statistics_for_current_dd function with the number of iterations you want and the confidence interval you wish to evaluate. The function will then return 4 values, the CAGR and Sharpe (called ‘cagr’ and ‘sharpe’) values for the present drawdown period plus the expected worst case values (called ‘wc_cagr’ and ‘wc_sharpe’) for the current period as well. If either cagr or sharpe are below wc_cagr or wc_sharpe respectively you can say that your system is not behaving as expected within the confidence interval you have described and you can stop trading. For these values to be useful you need to ensure that the number of iterations you have is high enough – make sure worst case values do not change by increasing the iteration number – and that the confidence interval is high enough, at least 99%. Note that you might get errors dealing with IO sometimes in Linux when your number of iterations is high, you can eliminate this problem by running the script using sudo.
For the sample system loaded above the current drawdown period has been going on for 220 days. The function returns a wc_sharpe of -2.20 and a wc_cagr of -0.21 while the cagr and sharpe values are -0.13 and -1.23. This means that while the system is within a drawdown period and its cagr and sharpe as far away from the long term statistics – which are obviously positive – these values are still well within what is expected for a drawdown period of this length. You can instantly see the benefits of using a function like this to evaluate whether your system has reached a worst case scenario, there is no more “guessing” or “personal judgement” in whether a system has to be discarded or not, you can simply perform a simulation and say without hesitation whether or not your system has reached a point of no return. Oregon City You also don’t have to manipulate the tests or decide from where to test or what to test, the function does it all for you.
–

–
Please also note that the above statistics for the sample test might change for you – although they will never be above the currently measured statistics for the drawdown period – as the number of iterations is not very big (200) when you perform this same exercise for your trading strategies you might want to start at a higher level (probably around 1000) so that you can get measurements that are far less variable. Also note how I have changed the behavior of the library compared to the last post involving failure detection using qq-pat, the library now does show the number of business trading days that make up a drawdown period instead of simply the number of trading days as days in which the trading system takes a position. This makes graphs much easier to interpret.
With the above code it suddenly becomes easier to perform things such as automatic worst case detection using qq-pat and your latest up-to-date back-testing results, something that I cam currently implementing for Asirikuy members. If you would like to learn more about system failure detection and how you can use several techniques to judge whether your systems are behaving outside of what is statistically expected from them please consider joining Asirikuy.com, a website filled with educational videos, trading systems, development and a sound, honest and transparent approach towards automated trading.


