I have written several articles before about the reproduction of the results shared within this nature scientific reports article that talks about the prediction of financial time series using Chaos related properties. However up until now no one – that I am aware of – has ever performed an actual back-test using this strategy to see whether the proposed methodology does indeed constitute an inefficiency and can generate profit beyond trading costs. On today’s article we are going to be using R to perform a back-test of a strategy using this sort of predictions using 1986-2016 monthly data for 16 different currency pairs (you can download the data here). Within this post I will talk about some of the modifications made to the original methodology as well as what the back-testing results tell us.
–
library(pracma)
library(quantmod)
library(fractaldim)
library(ggplot2)
library(e1071)
library(PerformanceAnalytics)

symbol.set = c("EURUSD","AUDUSD","GBPUSD","EURJPY","GBPJPY","USDJPY","USDCAD","EURCAD","USDCHF","EURAUD","AUDCHF","AUDCAD","GBPAUD","CHFJPY","CADJPY","EURCHF")

par(mfrow=c(4,4))
all_results <- c()

for (x in 1 : length(symbol.set)) {
  path <- paste("/path_to_data_files/", symbol.set[x], "1987_MONTHLY.csv", sep="")
  fxdatatemp <- read.zoo(path, sep = ",",format="%d/%m/%y %H:%M", header=FALSE,index.column=1)
  fxdata<- as.xts(fxdatatemp)
  colnames(fxdata) <- c("open", "high", "low", "close", "vol")

  fxdata <- Delt(fxdata$close, type="arithmetic")
  fxdata <- fxdata$Delt.1.arithmetic[2:length(fxdata)]
  fxdata <- cumprod(1+fxdata)

  cat("loading", symbol.set[x] , '\n')
  results <- c()
  method <- "rodogram"

  for(i in 41: (length(fxdata)-1)) {
    data <- as.numeric(fxdata[1:i])
    delta <- Delt(data, type="arithmetic")
    fdim_ref <-fd.estimate(data, method=method, trim=TRUE)$fd
    last_value <- as.numeric(data[length(data)])
    min_change = 100

    for(j in 2:length(delta)){
      new_data <- c(data, last_value+last_value*delta[j])
      fdim <-fd.estimate(new_data, method=method, trim=TRUE)$fd

      if (abs(fdim-fdim_ref)<min_change){
        min_change = abs(fdim-fdim_ref)
        prediction = delta[j]
      }
    }

    real_value = (as.numeric(fxdata[i+1])- as.numeric(fxdata[i]))/as.numeric(fxdata[i])

    if ((prediction > 0 && real_value > 0) || (prediction < 0 && real_value < 0)){
      results <- c(results, abs(real_value)-0.0003)
    } else {
      results <- c(results, -abs(real_value)-0.0003)
    }

    print(i)
  }

  results_xts <- as.xts(results, order.by=index(fxdata[41:(length(fxdata)-1)]))

  if (x == 1){
    all_results <- results_xts
  } else {
    all_results <- merge(all_results, results_xts)
  }
  plot(cumprod(1+results_xts), main=symbol.set[x])
}

colnames(all_results) <- c("EURUSD","AUDUSD","GBPUSD","EURJPY","GBPJPY","USDJPY","USDCAD","EURCAD","USDCHF","EURAUD","AUDCHF","AUDCAD","GBPAUD","CHFJPY","CADJPY","EURCHF")
charts.PerformanceSummary(all_results, ylog=TRUE)

charts.PerformanceSummary(Return.portfolio(all_results), ylog=TRUE)
–
The above R code can be used to reproduce the back-testing results shown through the rest of this article. The strategy is a simple Chaos based prediction strategy which uses the fractal dimension as a chaos property and predicts the next return such that the value of the fractal dimension for the entire data varies as little as possible. The test uses monthly data and simply takes an unleveraged trade at the beginning of each monthly period. If the prediction is right then the absolute value of the monthly return is added to the system results while if the predicted and actual returns are not of the same sign the negative of the absolute value of the return is added to the system results. A trade cost of 0.03% is included within each transaction which is representative of the average trading cost when making unleveraged trades in the Forex market. This cost is possibly too high for many pairs and therefore constitutes a pessimistic scenario in terms of trading costs.
As I wrote on a previous article the original paper suggested using a normal distribution to draw potential returns but as we found out this generated ever variable results which meant that each simulation gave a different answer. For this reason I decided to instead use the historical distribution of return as a pool for potential returns which implies that the choices are always the same and the simulation results are therefore always exactly the same. In the above simulation all past data is used for the prediction of the next return, with new data added as more information comes in. Of course this establishes startup point dependence in the simulations – meaning the results you get depend on how much data you have – but according to the original paper author’s the more data you have the better as you will have a better idea of the long term chaos property value of the series. Techniques such as moving windows can be implemented – which introduces an additional parameter – with very similar results.
–

–
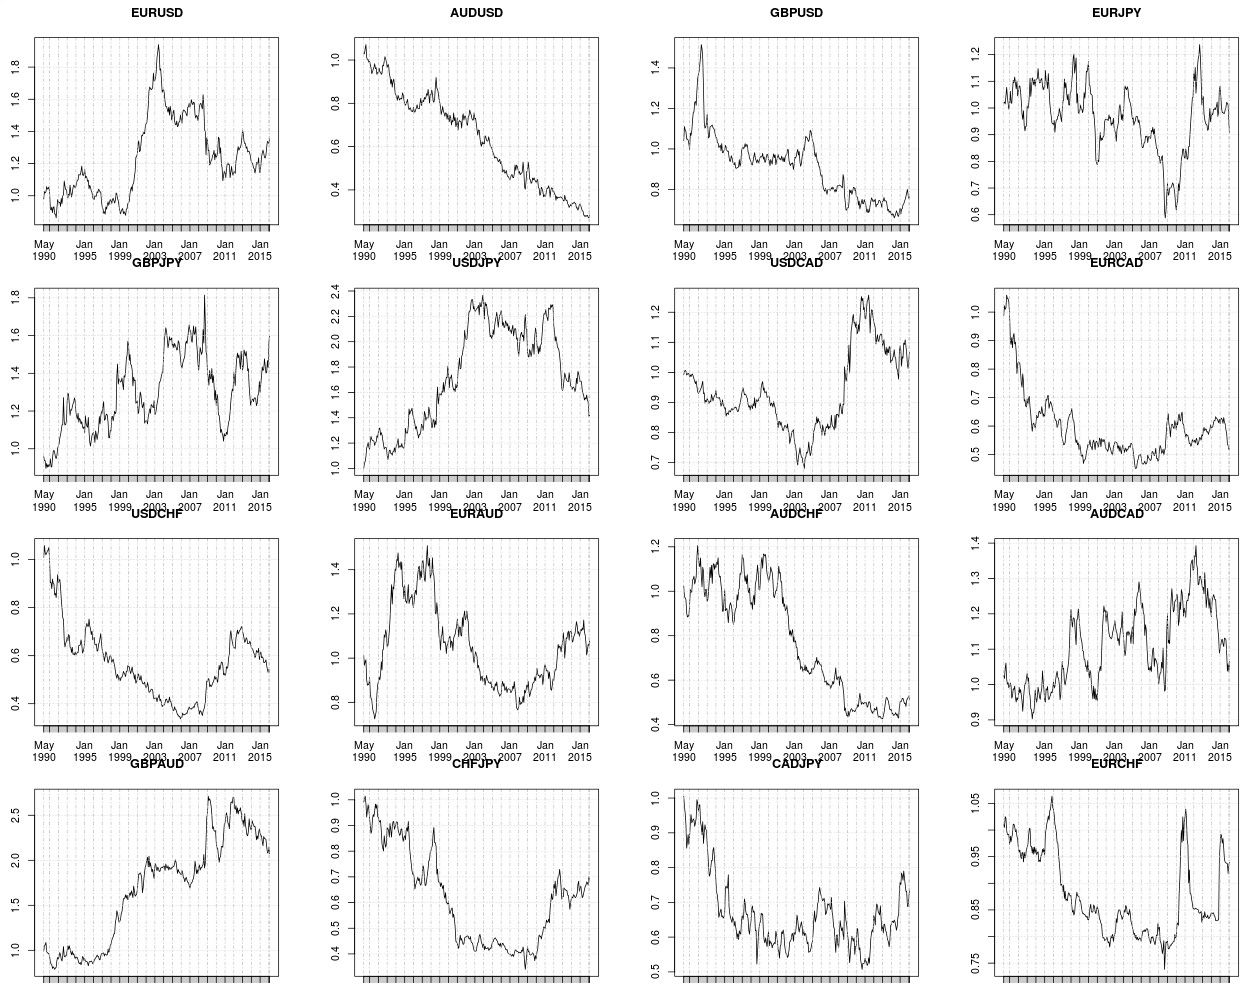
The system does not provide any systematic profit within the overall currency set and neither does it show any wonderful ability to make predictions — as suggested by the authors of the paper. It finds some success on a single symbol – the GBP/AUD – but even then the results are not good enough as to be considered outside of what is possible through random chance. Results on some pairs are substantially bad – for example on the AUD/USD the curve is essentially a straight down slopping line – but reversing the logic for this pair does not yield any significantly relevant results due to trading costs. This shows that the hypothesis that the fractal dimension should remain constant as a function of time is false, which is not surprising given that we have seen that the fractal dimension is indeed not constant within currency pairs — as I showed on some previous articles.
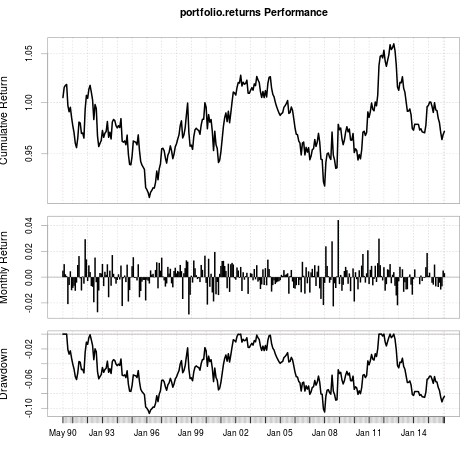
The curve below showing the 16 symbol portfolio performance further highlights this point. As you can see the results seem to follow a very slowly down slopping random walk which is what you would expect from mixing a bunch of trading curves with no real edge within them. However it is rather interesting to note that there seems to be a significant increase in the ability to make accurate predictions during the 2007-2011 period suggesting that during the crisis there was an increasing likelihood of the fractal dimension for monthly data to remain constant within the series. This happens across several symbols, which is interesting although not surprising given the significant degree of correlation between different Forex instruments.
–

–
Of course these tests do not rule out that chaos based predictions can work, merely that on the monthly timeframe on these 16 currency pairs the hypothesis is wrong. The fact that the predictions do not improve as a function of time within the test also highlights that it’s not a problem of converging the fractal dimension of the series to its long term value although of course much more data would be needed to properly address this question. This however says nothing about the results this could have on lower timeframes, using other fractal dimension calculation methods – I used the “rodogram” method here as showed within the R code – so there are still many venues to explore if you’re interested in doing this. Using things such as stops within the code might also significantly improve the results as it might prevent huge losses on wrong predictions.
After a lot of experimentation on Chaos based predictions it seems more and more that this type of prediction cannot work very well. Analysis of chaos based properties using moving windows suggests that they do vary a lot with time across fixed segments and further analysis of how the whole-series property values changes with time suggests that they do change significantly as more data is accumulated. Therefore this proposed chaos prediction algorithm offer no magical results and given that it’s core assumption tends to be false for most symbols this does not come as a surprise. If you would like to learn more about trading systems and how you too can create and back-test your own strategies please consider joining Asirikuy.com, a website filled with educational videos, trading systems, development and a sound, honest and transparent approach towards automated trading.strategies


