Last week I wrote a few posts on the use of minimum variance optimizations, their computational cost and their implementation within the qqpat library. Today I want to talk a bit about how the minimum variance optimization compares with the traditional markowitz optimization (the mean/variance optimization) to understand which of the two is the best solution when building trading portfolios made up of historically long term profitable trading strategies. First I am going to explain the differences between this two optimization types and then we’re going to take a look at the pseudo out-of-sample Sharpe ratios between these two implementations and how they compare. In the end we’ll be able to make some interesting comparisons between both optimizations that will lead to some conclusions that are in agreement with the bulk of the research financial literature on portfolio optimization.
–

–
When doing portfolio optimizations the theory first developed by Markowitz tells us that we should attempt to maximize our returns and reduce our volatility. This means that we should make the largest possible effort to attempt to increase the Sharpe ratio of our portfolio if we want to trade in the best possible way. This translates into doing a mean/variance optimization – basically maximize the Sharpe ratio of the portfolio – to achieve the portfolio that has the potential to get the highest possible risk adjusted return level. However – as we saw last week as well – the problem with portfolio optimizations is that we do not know the way in which the relationships between assets will change in the future and therefore optimizing a portfolio based on historical information usually leads to results that are much poorer within out of sample trading.
Many people in the financial literature advocate for the use of the minimum variance optimizations instead of the mean/variance optimization because the estimation errors are considered to be lower in the minimum variance optimization problem, even if there is no effort to maximize risk adjusted returns. The larger errors in the mean/variance optimization come from the fact that future mean returns are often harder to predict than future variance and therefore the compounding of mean and variance errors leads to much worse performing portfolios. The reduction in the estimation error in minimum variance optimizations often leads to potentially lower disappointment in the out-of-sample when you compare it with the results of a mean/variance optimization.
–

–
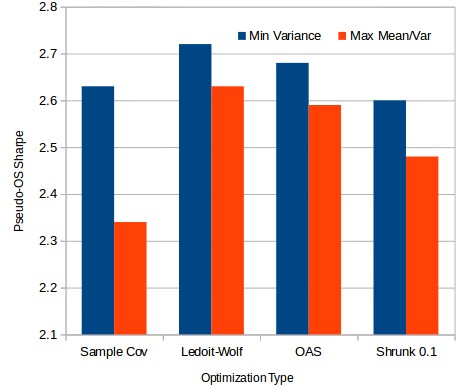
The first graph on this post shows the comparison in a pseudo out of sample for a 2000 trading system portfolio. The portfolio weights were calculated using monthly returns and various covariance matrix types from 1986 to 2001 and the Sharpe ratio was then calculated from 2001 to 2016 using these weights. As you can see the results show that the minimum variance portfolio always gives better pseudo out of sample Sharpe ratios. The most drastic difference comes when you use the sample covariance where the pseudo out of sample Sharpe goes from 2.34 using mean/variance optimization to 2.63. Since the shrunk covariance matrix types offer some estimation error reduction we can indeed see this difference become smaller when using other covariance matrix types but the results show that the mean/variance optimization always gets consistently poorer results.
Furthermore the estimation errors between in sample and pseudo out of sample Sharpe ratios are simply huge when doing mean/var optimizations. As you can see in the efficient frontier graph the portfolios in the efficient frontier have much higher returns at lower volatilises compared with the individual systems, an improvement that is unrealistically overestimated. The mean/variance optimization using the sample covariance gives a portfolio with an in-sample Sharpe ratio of 17.25, which is extremely unrealistic and in fact moves back to a 2.38 value within the pseudo out of sample period. This shows that this Sharpe is achieved by relying on historical correlations of returns that are simply not constant through time and change in a way that generates very strongly disappointing out of sample results. This heavily supports the observations made by Ledoit and Wolf in their paper on covariance matrix shrinkage, nobody should be using sample covariance mean/variance optimizations.
–

–
http://kaminakapow.com/seamless-crochet-donkey-pattern/?moderation-hash=bcc7b6ab59ed0abacb68e01d856674bd It is therefore particularly dangerous to rely on the risk determinations of mean/variance portfolio optimizations since you might very heavily underestimate the potential drawdown scenarios of the portfolios. A decrease of almost 8x in the Sharpe ratio when going to a pseudo out of sample period shows that the maximum drawdown could easily be underestimated by a factor of 2 or 3x. The same type of risk underestimation applies to the minimum variance optimization although in that case the underestimation is substantially lower due to a lack of effort in the direct maximization of the historically risk adjusted return. However care must always be taken when using portfolio optimization since the Sharpe ratio will always be overestimated due to the simple presence of estimation errors.
Nonetheless – as showed in this post – you can indeed expect some increase in the out of sample Sharpe relative to an equally weight portfolio provided that the portfolios you are trading are large enough. In this case the minimum variance optimization should be used but the actual portfolio risks should not be derived from the in-sample portfolio weights derived from the minimum variance portfolio but instead from a naively optimized portfolio – such as an equally weight portfolio – where estimation errors will be much lower (as no assumptions based on historical correlations are made). If you would like to learn more about portfolio optimization and how you too can create and trade large system arrays please consider joining Asirikuy.com, a website filled with educational videos, trading systems, development and a sound, honest and transparent approach towards automated trading.strategies


