As you may have seen during the past few blog posts I have been writing a lot about minimum variance optimizations and how to perform them using different types of python libraries. Thinking about making this type of procedure more practical I decided to implement this functionality within the qqpat library so that any of you who want to perform this type of optimization can do so in a very easy-to-do manner. On this blog post I will be going through some sample code and examples using qqpat to perform this procedure in the hope that any of you who want to do minimum variance optimizations will be able to do so with just a single function call. To reproduce the exact results within this post please download the files available here. To perform this analysis you need to have qqpat >= 1.513 installed (remember that you can update qqpat by using the command “pip install qqpat –upgrade”). Remember that qqpat is an open source library, available at github.
–
import pandas as pd
from pandas_datareader import data
import datetime
import qqpat
import csv
def lastValue(x):
try:
reply = x[-1]
except:
reply = None
return reply
system_list = ["sys0", "sys1", "sys2", "sys3", "sys4", "sys5"]
for index, system in enumerate(system_list):
tradeTimes = []
tradeBalance = []
with open(system + ".txt", 'rb') as csvfile:
reader = csv.reader(csvfile)
for idx_data, row in enumerate(reader):
if idx_data > 0:
tradeTimes.append(datetime.datetime.strptime(row[3], '%d/%m/%Y %H:%M'))
tradeBalance.append(float(row[10]))
if index == 0:
data = pd.Series(data=tradeBalance, index=tradeTimes).resample('D', how=lastValue).pct_change(fill_method='pad').fillna(0)
else:
data = pd.concat([data, pd.Series(data=tradeBalance, index=tradeTimes).resample('D', how=lastValue).pct_change(fill_method='pad').fillna(0)], axis=1)
data = data.fillna(0.0)
analyzer = qqpat.Analizer(data, column_type='return', titles=system_list)
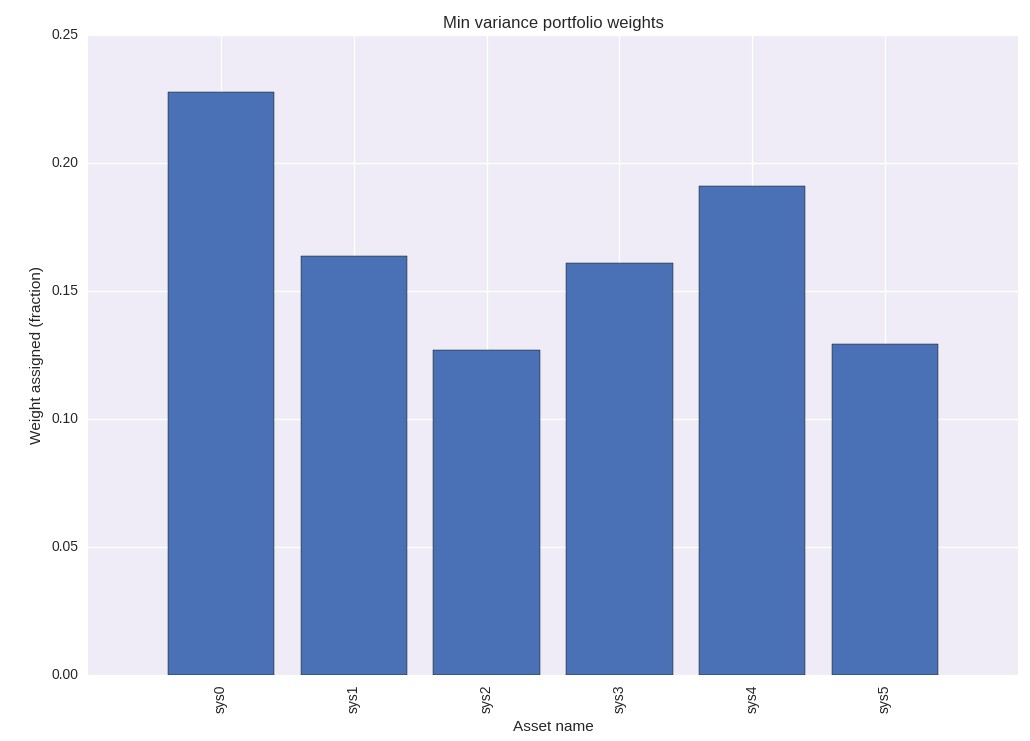
weights = analyzer.min_variance_portfolio_optimization(plotWeights=True)
analyzer.plot_analysis_portfolio_returns(weights)
analyzer.plot_analysis_returns()
–
The idea of a minimum variance optimization is to obtain the asset weights that makeup the portfolio that has the lowest possible historical variance. This is sometimes preferred to mean-variance optimization – obtaining the portfolio with the highest Sharpe – since it’s generally agreed that the estimation errors in the mean are often worse than those of the variance component. Another important issue is that the analytical solution of the mean-variance optimization problem is much more difficult while the solution of the minimum variance optimization problem is relatively easily attainable using the covariance matrix. This means that the variance minimization often leads to better out of sample results at a lower computational cost. Granted I have not confirmed this personally using very large portfolios but only the knowledge I get from the published literature I have read so far on the matter.
–
–
I have now added new functions to qqpat that allow you to easily perform this analysis. To do this you simply need to create a dataframe containing the returns or balance changes for all your systems and then use the min_variance_portfolio_optimization function of the analyser to perform the optimization. This function also has a “plotWeights” option which if set to true generates a bar chart that graphically shows you the fraction of the portfolio assigned to each one of the systems. If you run the example with the 6 systems it contains you should obtain a graph like the one showed above. As you can see here the library has assigned system 0 the highest weight while system 2 has the lowest one. This visual analysis allows you – at least for relatively small numbers of systems – to get an idea of how the portfolio is composed. For much larger arrays of systems a graphical analysis like this is much harder unless much larger images are produced. The test.py file that comes with the program also performs a similar optimization using TLT, IBM and AAPPL stocks.
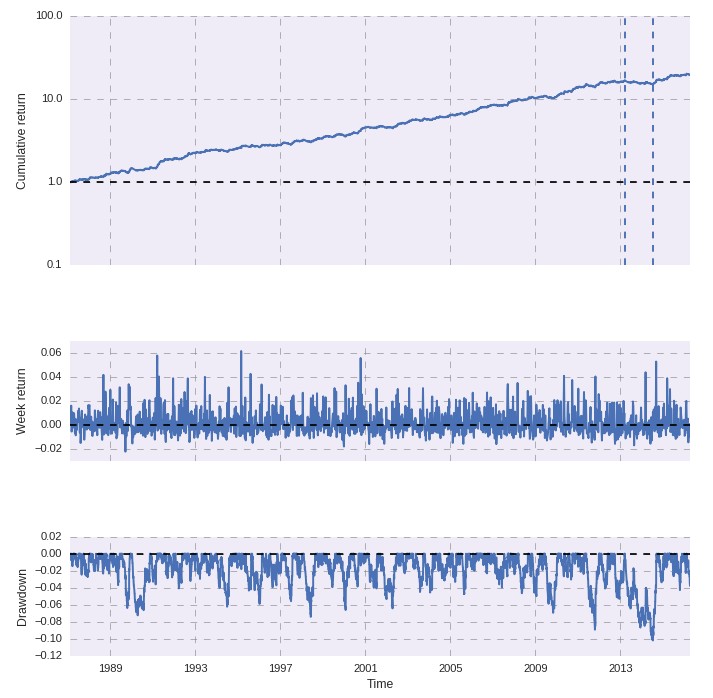
Once you have the weights calculated through the optimization process you can then graph the resulting portfolio using the plot_analysis_portfolio_returns function. This function requires a weight parameter that must contain a number of values equal to the number of columns within the loaded dataframe. In essence it can build any portfolio graph provided any specified set of weights. This generates a regular PerformanceAnalytics style plot containing the results of a portfolio obtained through a simple vector based simulation process, as showed in the image below. This means that some approximations may have been made depending on the resolution of your available data, however the results should be a good approximation at historical portfolio performance.
–

–
If we look at the portfolio graph and the single system graphs we can immediately notice that the portfolio does provide an important decrease in overall variance compared to any of the individual systems. For example system 2 suffered from a large drawdown near 2002 which was almost totally eliminated in the portfolio thanks to the much better performance of other strategies within this period. A similar thing happens for many drawdown periods for the other strategies as it is a mathematical fact that combining systems with a positive expectancy with a correlation different from 1 immediately leads to a reduction in portfolio variance. Of course the largest portfolio drawdown is near 2013-2014 where most of the systems have drawdown periods that align. The overall drawdown within this period is however only around 10% while it reaches values near 30% for some strategies.
Of course the above is only the tip of the iceberg of what I want to implement regarding portfolio optimizations as we can include many more things such as covariance shrinkage functions, mean variance optimizations, entropy based optimizations, etc. If you would like to learn more about portfolio optimizations and how you too can trade very large system portfolios – using thousands of systems – please consider joining Asirikuy.com, a website filled with educational videos, trading systems, development and a sound, honest and transparent approach towards automated trading.strategies


