On yesterday’s post I talked about the computational cost of minimum variance optimization algorithms and how the CVXPY library using SCS leads to results that are almost 10x as fast as those of the other python library implementations. However I also mentioned how vanilla minimum variance optimization is bound to lead to disappointment in real trading as heavy estimation errors cause the technique to fail bluntly when trying to balance a portfolio for unknown market conditions. Today I want to further test this notion by performing tests of vanilla and modified minimum variance optimization procedures to compare their in-sample results with a pseudo out of sample period created from slicing the historical data available for our strategies in half.
–

–
The following tests were done by using our trading system repository results from 1986 to 2016. The monthly return data (351 data points) was split in half, the first half was used to balance the portfolios while the second half was used as a pseudo out of sample test. Note that I am calling this pseudo out of sample because it is not true out of sample data – unknown market conditions – but merely data that was not used for a portfolio optimization process. This experiment therefore allows us to get a glimpse at what happens if we perform some balancing procedure across our systems for a period and they then continue to work perfectly well through a subsequent period of equal length but with potentially varying correlations. In real life – a real out of sample – some systems will fail and we will not have the opportunity to rerun our systems or optimization algorithms a second time across the data (you only get to trade the real market across a given period once). The test herein therefore assumes that systems will continue to work in the subsequent period and that balancing efforts won’t be repeated after the first balancing trial. Sharpes are derived from monthly returns.
What can you do to improve minimum variance optimizations? The literature has several options but the most popular ones involve using shrinkage methods to better estimate the covariance matrix which is bound to become filled with extreme values when the number of systems is significantly bigger than the number of returns in the data. The seminal paper by Ledoit and Wolf on this methodology provides some clear reasons why using the sample covariance matrix – the covariance matrix calculated from the returns – leads to much worse results when compared to shrinkage methods. Besides the Ledoit-Wolf method for covariance matrix shrinkage there are other methods such as OAS which provides some advantages if the data is gaussian (you can calculate the covariance matrix of the log return to achieve this effect). We can also do a direct shrinkage of the sample covariance, which is what is done by Shrunk 0.1. You can read this sklearn article for a good overview of several different methods and their accuracy.
–

–
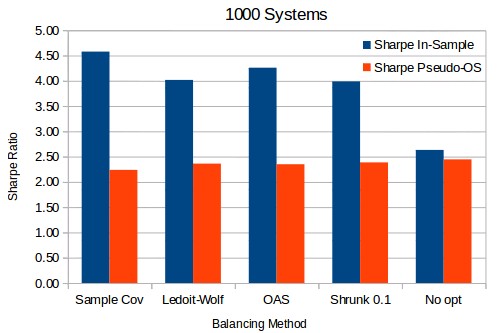
The first image above shows that for a 1000 system portfolio the in-sample Sharpe ratios are heavily over-estimated in all cases compared to the pseudo out-of-sample Sharpes. This is not surprising as system correlations change significantly across periods and the fit using any method is nothing but an excessive curve fitting exercise, the estimation error is too large. The only realistic estimation comes from the equal weight portfolio (No opt) which simply does not carry out any type of optimization process but weights all systems equally. Nonetheless we can also see that the estimation error is indeed lower for the methods that do shrinkage instead of using the sample covariance. In agreement with the Ledoit and Wolf paper as well as several papers after it there is a clear benefit in using shrinkage when it comes to estimation errors.
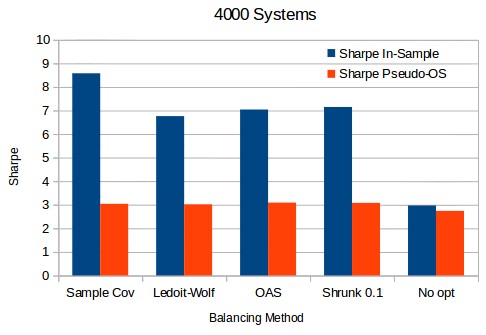
Things start to get very interesting when the portfolio size starts to grow significantly. When we have 4000 systems – as in the second image above – you can already see that the estimation error gap between the sample covariance and the shrinkage methods starts to grow bigger but most interestingly, the Sharpe in the pseudo out of sample period starts to become significantly bigger for the optimized portfolios compared to the non-optimized portfolio. This means that as more and more systems are added optimization methods are bound to perform better under varying correlations than the naive balancing method using equal weights. provigil to buy online Although the in-sample estimations will always be hugely over-estimated there is an expectation to achieve a real improvement when using minimum variance optimization methods for large portfolios across unseen data, provided the systems all continue to work as expected.
–

–
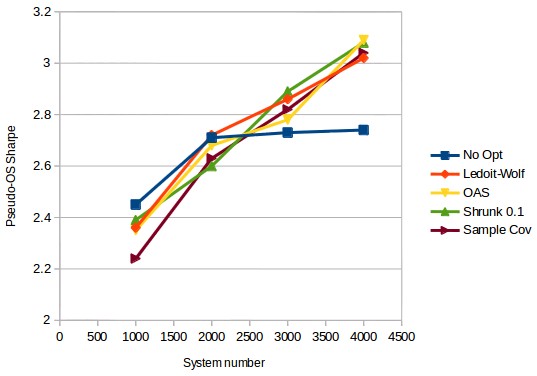
The third graph shows how there is indeed a trend that marks this behavior. For a non-optimized portfolio things start to look almost the same after around 2000 systems – there is little improvement in the Sharpe ratio in the pseudo-OS – while for portfolio optimization methods there is a substantial difference for larger portfolios as the pseudo-OS Sharpe ratio follows a linear trend for all methods. Although all methods show this tendency the sample covariance method does tend to be in the top bottom 2 methods across the entire range. The OAS method tends to show the best results although all methods may reach nearly the same pseudo-OS Sharpe ratios at much higher system numbers as the difference does seem to narrow between the methods as more systems are added. We will go more into the way that weight allocation between systems changes between the methods on a future post. If you would like to learn more about portfolio construction and how you too could build system portfolios using thousands of uncorrelated strategies please consider joining Asirikuy.com, a website filled with educational videos, trading systems, development and a sound, honest and transparent approach towards automated trading.strategies


