During the past few weeks we have looked both at the standard deviation and autcorrelation for the fractal dimension (FD) and Hurst Exponent (HE) of 200 hour sliced data on 16 different Forex symbols. From this analysis we were able to rank symbols according to the standard deviation of their HE or FD values which corresponded nicely with the system abundance obtained by mining on the different currency pairs using different methods. Today I want to take this analysis further and look at how the standard deviation of the HE values compares to the values expected from efficient time series. Through this post we will look at these deviations from random series and we will observe how the deviation changes relative to the distribution of values on efficient series and what this tells us about the Forex currency pair we are trading.
–

–
Although we have already established that lower standard deviation in the HE of sliced time series are strongly correlated with the ability to mine for more systems within them we still have not established how those values compare with those of efficient time series with the same distribution of returns. This is a necessary step because we could be looking at time series that naturally have a lower deviation due to their distribution and we could be naively drawing up a correlation that is unlikely to be of any causal nature. If my hypothesis about the deviation is to hold true and the lower standard deviation does have a causal relationship with the potential to find more systems then we should expect strong deviations from efficient series for those symbols where more systems can be found. We should be able to unequivocally demonstrate that the HE standard deviation is different from that expected for efficient series for these symbols.
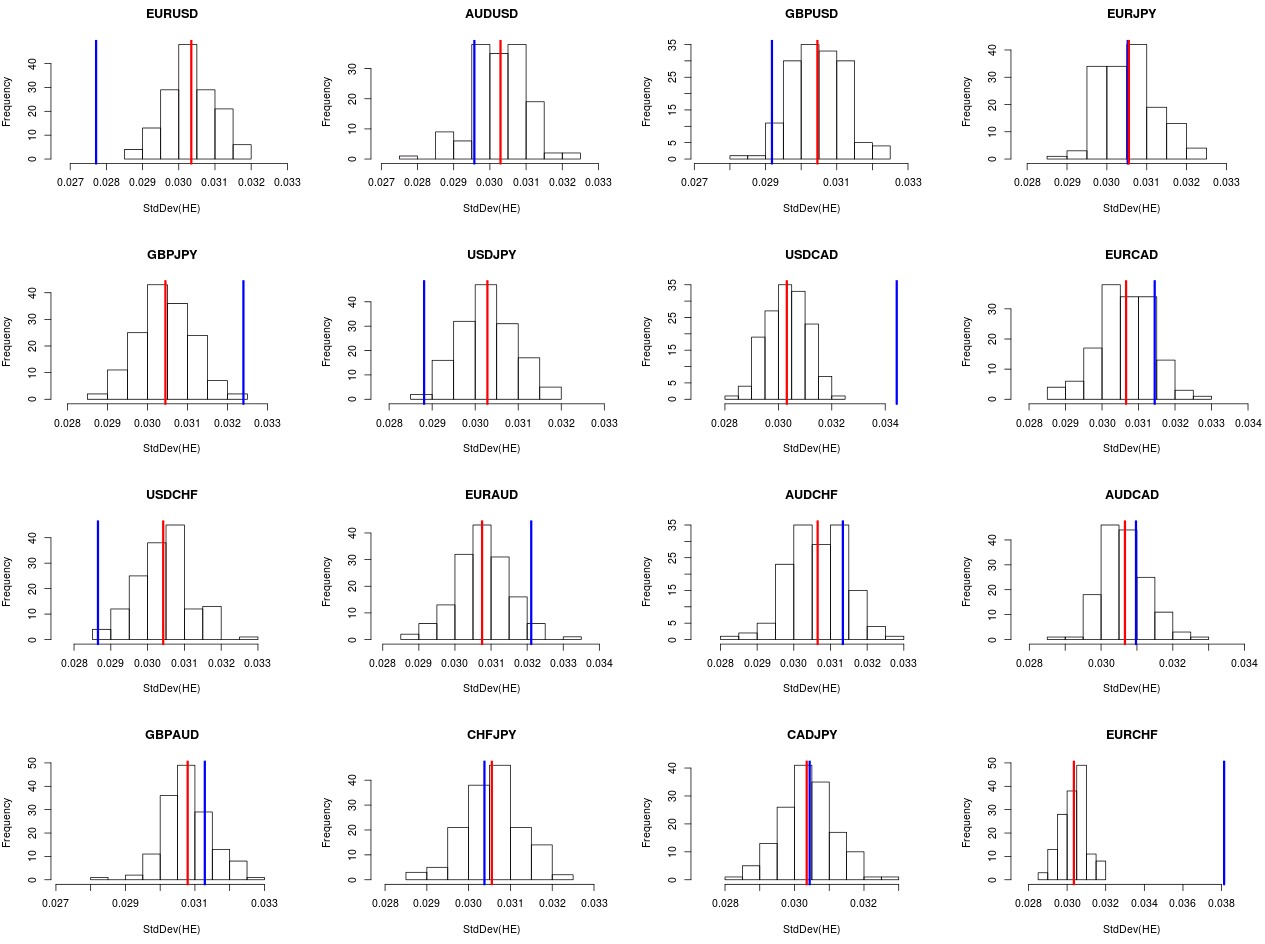
To perform this process I generated 150 series for each symbol using bootstrapping with replacement from the distribution of returns of each symbol’s 1986-2016 1H data. Each of these series was sliced in 200 bar segments and the HE was calculated for each one of them after which the standard deviation of this distribution of HE values was calculated. After obtaining the HE deviation for each one of the 150 efficient series I then plotted the distribution of HE standard deviation values on efficient series as well as the mean (red) and real data (blue) values on the first chart showed within this post.
–

–
The results almost speak for themselves. The EUR/USD has a very low standard deviation compared to the value expected from random series with the same distribution of returns, immediately pointing out that the variability in the HE on the EUR/USD is much lower than what you would expect for efficient series. It is so much lower in fact that we could differentiate the EUR/USD real series from an efficient series with a 99% confidence using a hypothesis test based on this distribution obtained from efficient series. It is not surprising when you look at these charts that the EUR/USD contains the highest number of potential systems across a wide variety of system mining methods, it simply has the smallest variation in symbol character as a function of time, implying that the persistance of inefficiencies within this series is the largest among the studied Forex symbols.
If you look at the GBP/USD, USD/JPY and USD/CHF you will find a similar phenomena although much less pronounced than in the EUR/USD case. In these cases the standard deviation is indeed much lower than the mean value from efficient series but systems are indeed expected to be much more difficult to be found since the deviations are not that strong. This matches our finding in real life almost exactly as our system searching process is always much easier on the EUR/USD compared to the other majors. Cases like the EUR/JPY and GBP/JPY are particularly puzzling since we know we can find some systems among them – much less than for the already mentioned symbols however – but their HE standard deviation does not look favorable at all, especially in the case of the GBP/JPY where it is much higher than expected from randomness. It may well be that the HE does not paint a full picture and we would need to further enhance this analysis with other measures such as FD and approximate entropy. Pesqueira However it is amazing that the standard deviation of the HE in sliced time series can already predict so much about where it will be worth it to search for the most trading systems.
–

–
The USD/CAD and EUR/CHF are also very interesting, with standard deviation values that are way above those expected from random chance. This happens because there are several clustered distributions of returns in time, that happen due to changes in the way in which the symbols have worked. When the series are shuffled the standard deviation immediately becomes lower, while on the real series this clustering creates a much higher than expected deviation. This is the consequence of having dramatic events that have changed the character of the symbols at some point in time, making all subsequent returns follow a different distribution and arrangement. Events like the SNB intervention on the EUR/CHF caused dramatic and persistent changes in symbol character, which is something we also observed when evaluating the FD in sliced data. These symbols are very unfavorable for the finding of long term inefficiencies, as symbol character is simply not predictable, something we have confirmed experimentally.
The above findings support my hypothesis and further encourage me to persue this research to create a robust efficiency index that can truly predict if you will or will not be able to find long term stable systems within a symbol. I will seek to reproduce the above results with the fractal dimension and then look at an efficiency index using the HE, FD and entropy to compare trading symbols. If you would like to learn more about system mining and how you too can use powerful computational techniques to find trading strategies while properly accounting for data mining bias please consider joining Asirikuy.com, a website filled with educational videos, trading systems, development and a sound, honest and transparent approach towards automated trading.strategies


