Last week I wrote a post about my analysis of the top out of sample live performers in our price action based trading repository. However this analysis was more qualitative than quantitative in nature and did not give us very precise information about whether systems do tend to mean revert and whether choosing systems that have been very profitable during the past year is bound to be detrimental to our system generation efforts. Today I want to share with you a much more quantitative analysis on mean reversion that takes a look at all the systems within our trading repository that have been trading for more than 4 months. With this analysis we’ll be able to answer the question of whether the last year of in-sample performance is expected to have any impact in terms of short term performance.
–

–
When we started creating trading systems we introduced a filter that only allowed systems with a good in-sample last year to become part of our trading repository. We did this because we thought that systems that had better last years were bound to perform better under current market conditions. However there were some systems that got through this process with losses during the past year due to the delay between the current time and the mining data. We usually mine with data that is only updated once every few months – as the mining experiments take time and need to use constant data sets – so when a system is added to the repository there might be two to three months of data that were not included in the mining process but are nonetheless part of the in-sample results. Some of the systems had strong losses in this months and were therefore able to pass with slightly losing last year results.
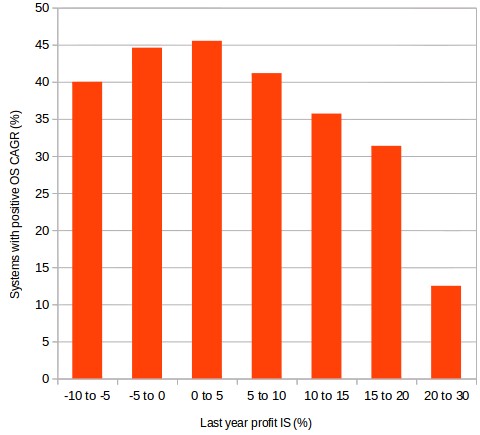
This became interesting when these systems – the ones with the worst last in-sample year results – started to be the most profitable systems in the out-of-sample. As I mentioned in last week’s post the top systems all have in common that they were within drawdown periods during the last in-sample year. When looking at the data of all our systems with more than 4 months of out-of-sample results and number of systems with positive out-of-sample CAGR as a function of the last in-sample year profit we get the first graph showed above. This graph clearly shows that there is a tendency for the number of systems with positive CAGR to drop as the last in-sample year profit increases, this strongly supports the hypothesis that systems tend to mean revert the more profitable they were in the recent past. Systems that had a 20-30% profit during the last year of trading tend to mean revert much more strongly than systems that had a 0-5% profit. As a matter of fact nearly 90% of these strategies mean revert.
–

–
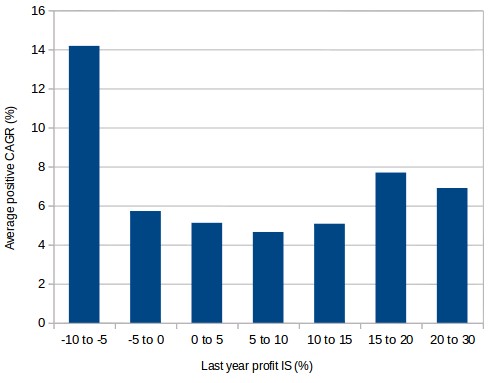
It is also worth noting that the number of positive OS CAGR systems also starts to go down as we move to more negative results in the last in-sample year. Although we do not have data for more negative systems than around -10% – due to the filter we imposed – it does seem that the value of positive CAGR systems in the out-of-sample has its maximum at around 0-5%. This also supports the hypothesis that using systems with negative results would not be better in terms of the number of systems that are expected to be profitable. Nonetheless the average OS CAGR of positive out-of-sample CAGR systems – second graph – shows that despite the decrease in the number of profitable systems, those that are indeed profitable tend to have much larger CAGR values. The average positive OS CAGR shows that systems that lose money in the last in-sample year tend to also mean revert strongly even though the number that mean revert might not be as high as for systems with higher last in-sample year profits.
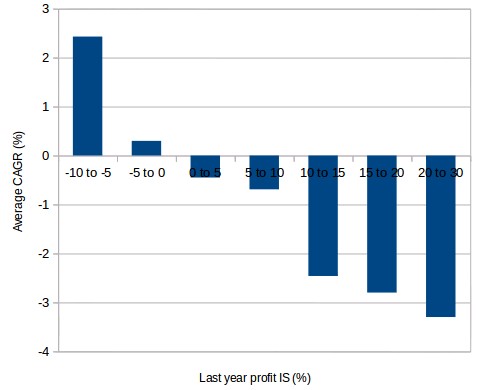
We can draw even clearer results by looking at the overall average OS CAGR for each last in-sample year profit class where it becomes apparent that the average OS CAGR follows a rather linear function relative to the last year profit (graph below). As a matter of fact the average OS CAGR for most classes is negative except for the two bottom classes where the last in-sample year profit is negative. This strongly supports the idea that systems tend to mean revert and that selecting systems with positive last year in-sample profits sets us strongly for short term failure as systems first mean revert and then take a significant amount of time to recover.
–

–
The above clearly does not mean that systems in positive last in-sample year results will always have negative results going forward – after all they are historically long term stable and profitable – but it just shows that they have tendency to mean revert in the short term. The large majority should indeed recover and reach new equity highs in the longer term but the expectation for short term profit is negated by their last in-sample year profitable results. It is rather counter-intuitive and yet fascinating to look at these results since it shows that short term results might actually benefit from selecting systems that have somewhat poor last year results while retaining their long term profitability. If you think about it this makes sense as when the market seeks to be efficient it will make the most exploited inefficiencies unprofitable, at least in the short term – systems with last in-sample year profitable results will be found and traded by many – while longer term inefficiencies that have been unprofitable in the recent past will tend to mean revert as very few people might be attempting to exploit them.
Right now we have removed the last year filter from our mining and will re-examine the above observations once we have an unbiased sample of trading strategies mined without selecting for profitable last in-sample year results. If you would like to learn more about our trading systems and how you too can trade our price action based repository using potentially thousands of strategies please consider joining Asirikuy.com, a website filled with educational videos, trading systems, development and a sound, honest and transparent approach towards automated trading.


