When you want to build trading system portfolios it is extremely important to make sure that the trading strategies used are not correlated to each other. However there are many ways to measure system correlations and you can have much better or worse results depending on how you decide to carry out these measurement. Different types of correlation measurements have different consequences and it may well be that two strategies will show to be extremely correlated in one way while very uncorrelated in another way. On today’s post we are going to look at the importance of the return frequency choice in the measurement of historical correlations and in particular we will be evaluating what the ideal frequency to perform this measurement would be. First we will talk about what we want the correlation measurement to tell us and then we will look at how using different return frequencies affects the correlation map for strategy ensembles.
–

–
It is a mathematical fact that positive expectancy assets with anything less than perfect correlation will generate a risk adjusted return that will be better than that of both separate assets. This is because in the long term returns add up while in the short term the downside moves of the different instruments will cancel each other at least to some extent (because the correlation is not perfect). The lower the correlation between the financial assets the greater this effect will be with the best case being that of completely uncorrelated trading instruments. Note that oppositely correlated instruments will not have a better result because two assets that have a perfect negative correlation (-1) will simply yield a return of zero (when one gains the other loses the exact same amount and vice versa).
However how do we measure this correlation? When we talk about correlation – especially when we talk about trading systems – we talk about how the changes in the balance curve between one system correlate to the balance changes in the curve of another one. That is, we want to know how the changes in system A compare to the changes in system B. Nonetheless these changes can be measured in different ways. For example are we talking about trade-by-trade changes? daily changes? weekly changes? monthly changes? Different measurements will show you different things, mostly because systems – unlike other assets like stocks and bonds – do not have to change the balance every day and in many cases most daily return values are actually zero.
–

–
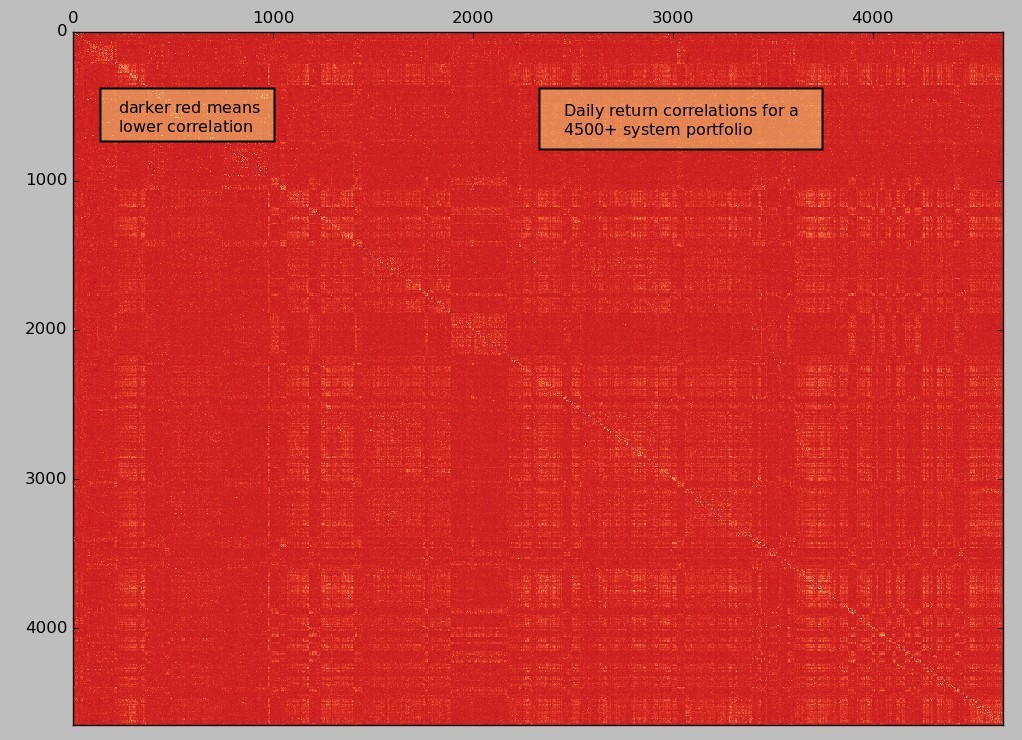
Imagine that you have two trading systems, one that always trades Monday and another that always trades Tuesday, both systems always make or lose 1% each time they trade. If you measure the correlation of both systems you will see that it will be close to zero. This is because for every Monday system A takes a trade with a +/- 1% result while B has a 0% result and vice versa. However it might well be that every week system A and system B have the exact same result, meaning that in reality they would make a terrible portfolio because every time system A takes a loss system B takes a loss, trading both would bring almost zero benefit. The problem we have here is that we are evaluating systems within a sampling time frequency where their trades never overlap and therefore their results appear to be entirely uncorrelated. A clear real life example of this problem is showed in the first image within this post, a 4500+ system portfolio correlation map derived from daily returns shows that the systems appear to all have extremely low correlations (almost all of them below 0.1).
Correlation measurements should therefore be based on a return frequency where all the strategies that will be evaluated are guaranteed to overlap, this means you must use the minimum frequency where all the systems are guaranteed to have traded at least once. In the example above this would mean using weekly returns for our correlation analysis, in that case we would immediately see that the systems have a correlation of 1.0 (what we would expect) instead of the result near 0 that we obtained for the daily returns. Going higher than that means that you will be evaluating a sub-optimal correlation because you will not be accounting for finer grain system oscillations that you could perfectly use. This means that you will probably avoid using systems that appear to be correlated in the longer term while in the shorter term they might indeed help offset each other’s drawdowns.
–

–
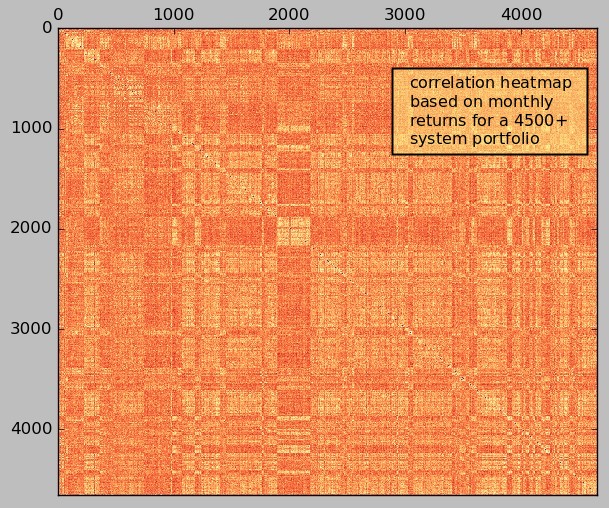
The second image above shows how things change when we move from a daily to a monthly return for the analysis of correlations for the 4500+ system portfolio. As you can see we can now get a clear and realistic picture of system correlations since all the systems trade at least once every month (some much more than that but none of them less). The correlations between the systems are still very low (all the monthly system-to-system correlations are below 0.5) which is indeed a requirement we impose in order to be able to add systems to our portfolios. If you would like to learn more about trading portfolios and how you too can analyse system correlations to design portfolios please consider joining Asirikuy.com, a website filled with educational videos, trading systems, development and a sound, honest and transparent approach towards automated trading.


