In the “Using OpenKantu in Practice” article series we study how we can use my open source price action based mining software – OpenKantu – in order to better understand the world of automated trading and create new trading strategies. Today I want to teach you how you can use OpenKantu to create strategies with historical results showing almost or absolutely no losses and why such systems are bound to always fail, regardless of how you attempt to modify them to make them look better. I will talk about why the idea of never losing systems builds strategies with excessive amounts of bias and why this implies that the search for such systems will never generate the expected trading results. This exercise is rather interesting as it perfectly exemplifies what happens when systems are generated without properly attempting to account for data-mining bias. You can look at this previous post in the series for a post in the same direction.
–

–
Let’s say you want to create a trading system that always wins. Most approaches to do this can be demonstrated to be equivalent and they are generally based in having an approach where the system is very eager to close trades at a profit but very hesitant to close trades at a loss. Random market volatility tells us that it will always be more probable for price to move a small amount in one direction than a large amount in the opposite direction so such systems often exploit this to achieve what appear to be “holy grail” levels of baffling profitability. This type of system can take the form of a grid or in our case simply a system where we have a tight TP with a very wide SL. The important thing to remember is that all of these strategies are eager to close at profit and very hesitant to close losses, which gives them their winning ratio.
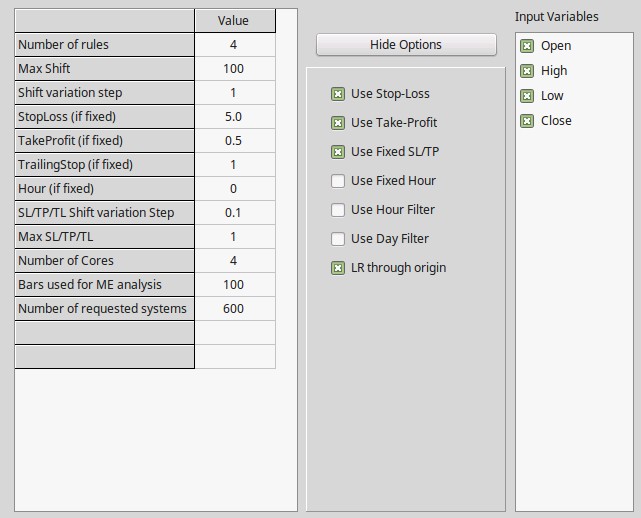
To do this in OpenKantu we can use a setting arrangement as seen above. In this case I am fixing the SL and the TP and I am making the SL 10x larger than the TP. While the SL is 500% of the ATR the TP is only 50%. This means that price will naturally be a bit less than 10 times more likely to hit the TP than the SL, meaning that the winning ratio of profitable systems found should be very high. I have decided to generate the systems from 1986 to 2000 using EURUSD 1H data in order to have a pseudo out of sample period from 2000-2016 so that we can evaluate how the systems did after they were generated.
–

–
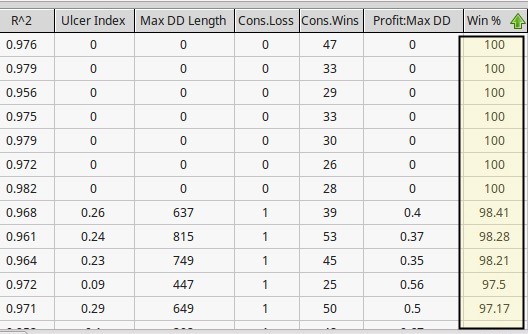
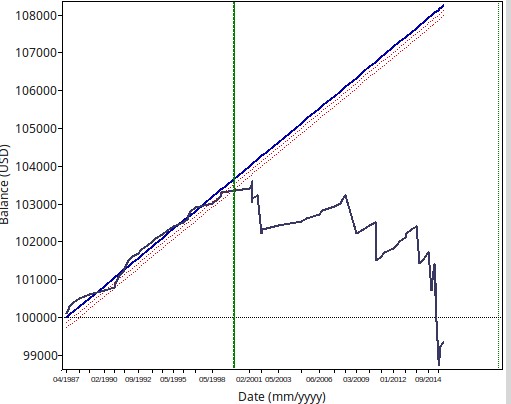
As you can see in the graph below it was fairly easy to generate several systems with 100% winning ratios and many others with winning ratios close to 100% (>=97%). However from the 100 systems I generated 94 of them generated losses within the subsequent 10 year period. A typical system curve is showed below. It is interesting to consider that although all of these systems are highly linear (R² > 0.95) they still show a very high tendency to fail under pseudo out-of-sample market conditions. Why is this the case if I have said time and time again that high linearity seems to preclude better results? Well the reason why systems fail here is simply data-mining bias. Most of these systems are not profitable because they have found some real historical inefficiency but simply because by chance it is far easier to hit a low TP than a high SL.
If you repeat this experiment on random data you will see that you will be able to find the same number of trading strategies and that you will never be able to tell whether a system is the result of a real historical inefficiency or simply the strength of the mining process. Tests on random data reveal that the results are just as likely when there appear to be no predictable relationships between past and future data, showing that the results we have obtained are not relevant. For high linearity to count you need your data-mining bias to be low.
–

–
These systems fail because they are most likely just obtained by chance. Since the SL/TP ratio we are using is favored by the mere properties of symbol volatility we are bound to find many entry logic sets that produce profitable results simply by chance. Of course such relationships fall appart under market conditions where the systems were not mined, simply because in this case there is no mining bias and the pseudo out of sample and the results just show what you would expect from randomly entering trades with that SL/TP ratio. As a matter of fact the pseudo out of sample results of these systems reveal just that to be the case, they are distributed just as you would expect a distribution of random trading systems with that SL/TP ratio to be. .
In the end this shows you why it’s not only important to aim for systems with some given set of statistical characteristics (like high linearity) but also why it is very important to mine for systems that have very low data-mining bias and are not just profitable because of random chance. If you only care about system statistics and you use unsound mining techniques – like the one above – you will be fooled by randomness. If you would like to learn more about mining trading systems and how you too can construct portfolios using large arrays of systems derived from low data-mining bias processes please consider joining Asirikuy.com, a website filled with educational videos, trading systems, development and a sound, honest and transparent approach towards automated trading.


