A short time ago I wrote an article about trading hours and their relationship with return directionality across several Forex symbols. However within this post I didn’t perform any system tests but merely showed that the analysis of the data from 1986-2016 had some good matches with previous research in terms of the by-hour returns (although we did not explore the cumulative return picture). Today I want to share with you the results of attempting to exploit this type of regularities in the GBP/JPY by building an automated trading strategy. We will talk about some of the results of this very simply trading strategy, how it could be potentially improved and why results have changed through time. For those of you who are Asirikuy members and are interested in reproducing these results the F4 code is showed below.
–
// Daniel Fernandez 2016
// http://mechanicalForex.com
// https://asirikuy.com

#include "Precompiled.h"

#include <ta_libc.h>
#include <stdio.h>
#include <stdlib.h>

#include "AsirikuyStrategies.h"
#include "EasyTradeCWrapper.hpp"

#define USE_INTERNAL_SL FALSE
#define USE_INTERNAL_TP FALSE

typedef enum additionalSettingsML_t
{
    SELECT_HOUR_1 = ADDITIONAL_PARAM_1,
    SELECT_HOUR_2 = ADDITIONAL_PARAM_2,
} AdditionalSettingsML;

AsirikuyReturnCode runTradeByHourEA(StrategyParams* pParams)
{

    if(hour() == (int)parameter(SELECT_HOUR_1)){
    atr = iAtr(1, 20, 1);
    return openOrUpdateShortEasy(0.0, atr*2);
     }

    if(hour() == (int)parameter(SELECT_HOUR_2)){
    atr = iAtr(1, 20, 1);
    return openOrUpdateLongEasy(0.0, atr*2);
     }

  return SUCCESS;
}
–
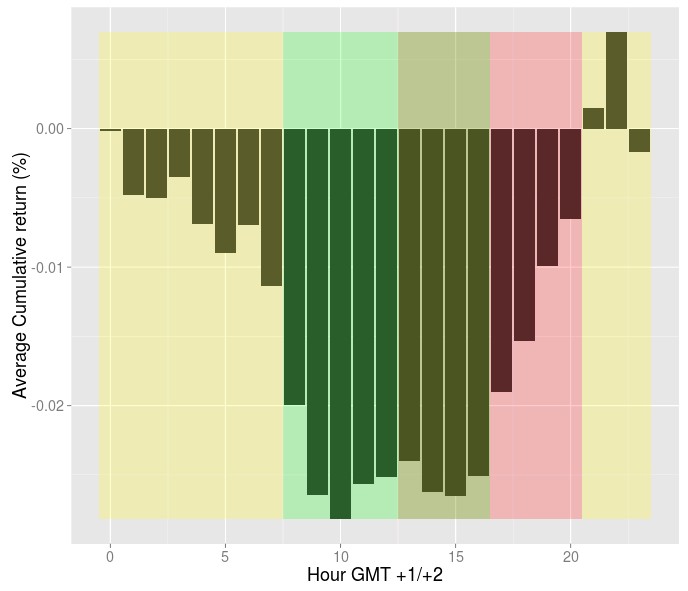
The second picture within this post shows the average daily cumulative return picture for the GBP/JPY extracted from 1986-2016 data with GMT +1/+2 shifts (sessions are color coded in yellow (Asian), green (European) and red (American)). From this cumulative return picture it is easy to see how we could construct a strategy by selling at the start of hour 23 and then buying at the start of hour 11. This would ensure that we grab all the average return variation from the highest point in the Asian session to the lowest point in the European session and then back up. A system based on this analysis requires nothing more but this very simple analysis. The above F4 code implements this with the only modification that a stop-loss of 2 times the 20 period daily ATR is used. This is a far placed stop that is just there to prevent excessive losses but that is only triggered a few times through the entire test. For this specific implementation parameter 1 would be set to 23 (short entry and long exit) and parameter 2 would be set to 11 (short exit and long entry). For this simulation a constant spread of 5 pips per trade was used.
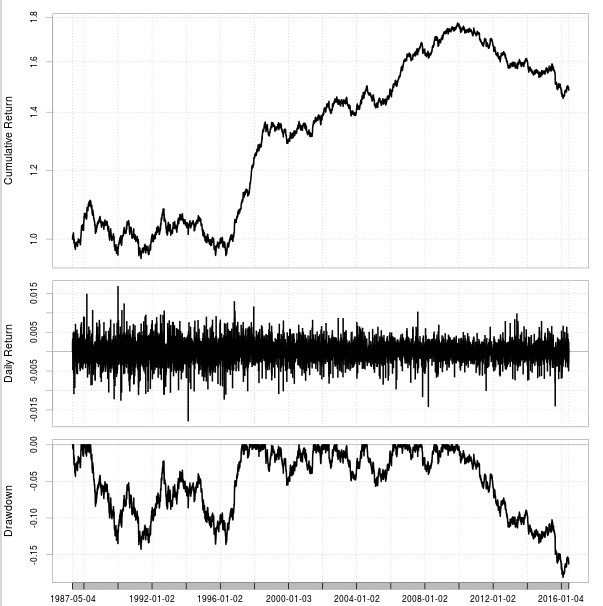
The results of this system – within the last image in this post- show how the system was able to make a net profit through the 30 year back-test and more importantly how the system was able to achieve quite decent results through basically the entire 2000-2010 period in a rather linear fashion. Although the statistics are nothing spectacular with a 1.3% CAGR and a maximum drawdown of 18% the results are indeed surprising as we can see a net profit above trading costs even on a high-cost symbol such as a the GBP/JPY. The strategy also has a quite low daily winning ratio of 36% with a risk to reward close to 1. Most importantly drawdown periods are very high, exceeding the 3K period length in the 80s with the present drawdown currently at 2383 days but still well above the Monte Carlo worst case thresholds for the system.
–

–
The interesting thing about the cumulative return plot is that it is rather stable across any 5 year chunk you pick from the back-testing data. The picture always looks similar with the GBP/JPY depreciating during the European session and then gaining through the American and Asian sessions. The main thing that changes depending on the chunk is that amplitude of this difference which mainly determines whether you’re able to beat trading costs. When the amplitude narrows it becomes impossible to profit as the return regularities are not strong enough. This very fundamental nature points to the fact that this is some sort of “inevitable” characteristic of Forex symbols although the trading results do show that it can be unprofitable depending on the average amplitude of the oscillations.
What I find most interesting about these results is how failure after an almost perfectly performing decade starts right at 2010 which is the year when academic studies about hourly regularities in the Forex market started to come out. My best guess is that at this time many quantitative traders got into studying and trading hourly regularities, something which has destroyed a lot of the potential profit by squishing the amplitude of the oscillations into mainly unprofitable territory on the GBP/JPY. My hypothesis is that this strategy has presently died due to the exploitation of the inefficiency and that it may only come back to life when traders who are using it become disappointed enough to stop. Of course many things could be done to attempt to improve results but this would all involve data-mining bias increases which would complicate the system creation process.
–

–
You may be asking yourselves why I published this article with the GBP/JPY instead of the more commonly studied majors which also show this type of regularities and the answer is that the full study including the four majors is currently under review for publishing in TradersWorld magazine. Within this article – once it’s out – you’ll be able to see how the trading system results change depending on the trading strategy in question. Of course if you would like to learn more about our F4 programming framework and how you too can use it to study this sort of behavior please consider joining Asirikuy.com, a website filled with educational videos, trading systems, development and a sound, honest and transparent approach towards automated trading.strategies.


I have got to say I just found your blog today while looking up some information on how to do something similar that you did with the pattern recognition and prediction using images. Just wanted to say good work and awesome news on the TradersWorld article.