During the last few posts we have been discussing reinforcement learning in Forex trading and it’s potential for the development of trading systems. After these posts it should be apparent that the most important issue with reinforcement learning – given its great power to learn from the data – is actually curve-fitting bias. Today I want to go a bit deeper into this curve-fitting issue and how we can actually predict whether a given reinforcement learning approach will or will not generate a usable trading algorithm. For this we will use some samples taken from my experiments with the same bullish/bearish state based Q-learning system I have used in the past couple of posts I’ve written on this subject.
–

–
In my last post we saw how increasing the degrees of freedom in reinforcement learning can affect the way in which the system performs under a pseudo out-of-sample period. From this it may seem that the best solution for the curve-fitting problem is simply to perform an in-sample/p-out-of-sample split and train the Q-learning approach on in-sample data while you evaluate the results within the pseudo out-of-sample data but this approach has some very important weaknesses that make it of limited usefulness. Since the pseudo out-of-sample data is always the same you get a lot of bias related with multiple testing, since you’re able to modify your Q-learning approach until it simply works on the pseudo out-of-sample, but it might just then work in the pseudo out-of-sample by chance – due to the data-mining bias you have introduced – and may fail across others. Is there an approach not subject to this multiple testing problem that could predict a given reinforcement learning setup’s potential?
Actually there is a way to do this. Since we want the Q-learning approach to only learn from information that is caused by market inefficiencies and not just by noise we can use data where there is only noise to see how successful our Q-learning algorithm can be. We can generate a time series using bootstrapping with replacement from the original data series in order to create a time series where there are absolutely no inefficiencies present since the returns have been randomly shuffled. If we apply a Q-learning algorithm to this random data we will be able to see how much information our algorithm is learning from noise and when we compare this to the amount of learning we can do on real data we can get a sense of how much we are actually able to get learning beyond what is expected from just the data-mining power of our learning algorithm.
–

–
The results in the first graph within this post show you exactly what happens when we perform this exercise using a Q-learning algorithm that learns from 8 or 9 past bar directions. As you can see both are able to learn substantially from the random data and increasing complexity from 8 to 9 bars does mean that we are able to extract more useless information from noise. However what is most interesting is that the difference between the learning using random data and the learning on the real data is the same for the 8 and 9 bar cases. This means that when you increase the number of bars in this case from 8 to 9 you’re gaining no new knowledge and you’re just getting more “fit from noise” that does not imply you’ll receive more profit. This goes perfectly well from what we learned from doing pseudo out-of-sample tests in my last post. The 7, 8 and 9 bar Q-learning exercises have virtually the same results in the pseudo out-of-sample and that’s because the difference between what is learned from noise and what is learned from inefficiencies is the same in the three cases. We can learn this from learning on random data without ever doing pseudo out-of-sample tests.
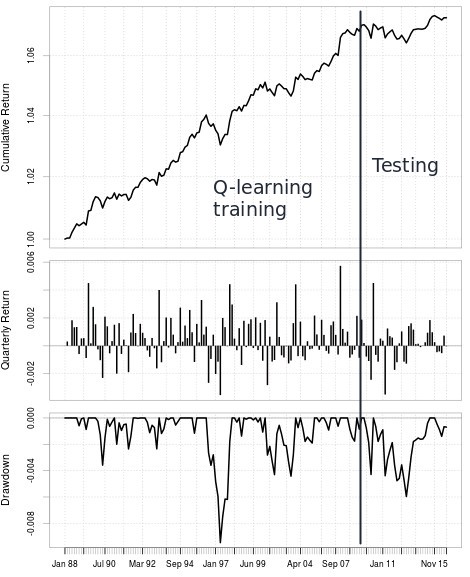
Random data gives you a very useful tool in this case because you now have a way to evaluate your Q-learning algorithm that has no problem with repetition. You can generate trillions of random data series and therefore you can test how well you learn from noise as many times as you want. If you’re able to increase the difference between what you learn from noise and what you learn in the real data then you’ll be able to get algorithms that have a much better chance at succeeding under new market conditions as the information they have learned from the market will be much more relevant for profitability. By modifying the Q-learning approach to expand this difference I was able to improve results to get the second image showed above. These results are much better and contain a pseudo out-of-sample that is a much better match to the in-sample period, note that I never used this pseudo out-of-sample within the modification process but just to showcase the result and why pseudo out-of-sample testing is not needed to improve a Q-learning approach.
–

–
Of course the above are just some initial steps in Q-learning and reinforcement learning in general but now that we have established a way to quantify how good a Q-learning approach might be (that is not simply historical testing) we can now experiment with modifying Q-learning and see what we get when we do different things. What if we used heiken-ashi bars? Indicators? What if we gave Q-learning the same information a human usually looks at? These are some of the things we will look into in future posts. If you would like to learn more about machine learning in trading and how you can create systems that constantly retrain please consider joining Asirikuy.com, a website filled with educational videos, trading systems, development and a sound, honest and transparent approach towards automated trading.strategies.


Hi Daniel,
sorry, but your approach is still not obvious to me:
What I understood is that you’ve trained on IS sample data and random data, while you are requiring that results on IS data have to be better as on random data. The optimum is reached when results on IS data can’t be improved through more training. As your graphs show, results on IS data are better than results on random data right from the start. This translates to me that you need only enough iterations to achieve this goal. The longer you train the better you get. However, that does not explain why longer training eliminates selection bias / curve fitting. What did’nt I get?
Kind regards
Fd
Hi Fd,
Thanks for writing. Well you always train till you see no changes in performance because you need to train until the policy converges, otherwise the results of Q-learning are unstable. What I have found here is that I want to maximize the difference between training the reinforcement learning algorithm on real and random data at the point of algorithm convergence. It does not matter if you see a difference as soon as you start trading, this difference should only be measured after you have trained enough for convergence to happen. Training for longer has nothing to do with curve fitting bias, what I am relating to this bias is the difference between real/random data training once the learning algorithms have converged (so at the end of the graphs). Let me know if you have any other questions about this,
Best Regards,
Daniel
Hi Daniel,
thanks for the explanation!
So you compare the distances between, let’s say random 8 bar and IS 8 bar (which gives X at the training) and random 9 bar and IS 9 bar (Y) results. If X > Y you would conclude that it would be best to use the 8 bar Q-learning model. Correct?
Kind regards,
Fd
Hi Fd,
Thanks for your reply :o). Yes, exactly. I would compare the distances at convergence and if the distance when using 8 bars is larger then I would go with 8 bars rather than 9. Most of the time you’ll see that introducing higher complexity does not generate a larger difference with learning on random data meaning that you’re just introducing bias without any real gains in predictive power. Let me know if you have any other questions,
Best Regards,
Daniel
Hi Daniel,
sounds reasonable. However, in your example graph (first one) the distance between 8 bar and 9 bar pairs (real/random) seems to be exactly the same, or at least very small and all curves are flat after 7 backtests.
Which conclusion would you draw here:
– neither 8 nor 9 bar Q-model are promising enough
– go for the 8 bar model as less complexity should lead to more realistic expectations
– go for the 9 bar model as return expectations are higher
Is the second graphic directly related to the upper graphic?
Thx for your work and sharing your insights!
Kind regards,
Fd
Hi Fd,
Thanks for your reply :o) Yes, your observations are exactly the point. Since the differences for 8 and 9 are exactly the same you can say that higher complexity is not useful in this case, you introduced an additional element that merely increased your curve-fitting bias and did nothing in real terms of explaining the underlying phenomena. Return expectations for 9 are actually not going to be higher than for 8 because we know that it’s just more curve-fitting, higher real expectations are much more likely related with expansions with the difference with results from random data. If you would have to choose between 8 and 9 you would therefore choose 8 because the difference between real/random results is just as large with lower complexity.
The second graph is a different experiment where I modified the Q-learning approach – modified the reward structure – to expand on the difference between the random and real data results and this ended up generating a result where the pseudo OS result behaves much more like the training period. This is of course far from proving that this is a general case but does match the hypothesis that increases in this random vs real result is what you actually want to find Q-learning approaches that really learn relevant underlying market phenomena.
As always thanks a lot for posting Fd and feel free to continue with the discussion if you have any additional questions/comments :o)
Best Regards,
Daniel