Systematic traders almost always use backtesting to assess the past performance of a trading algorithm. This is an incredibly valuable tool as it allows us to obtain an idea of how a trading algorithm would have performed in the past without having to actually trade a system for long periods of time. However the entire usefulness of backtesting relies on how well the simulations model past performance and therefore it is open to many pitfalls that arise from several practical concerns. Due to the above it’s very important to perform live/backtesting comparisons where a live traded period is compared to a backtest of that exact same period to see whether the results – regardless of whether they are positive or negative – match. On today’s post I want to discuss an analysis of live/backtesting consistency I have made using data from more than 1 million live trades taken from more than two thousand Asirikuy created systems.
–

–
There are several ways in which a backtest can make the past look better than what it would have really been like. In real trading there are usually liquidity, timing and spread concerns that are generally very hard to take into account in backtesting. In Forex trading historical liquidity data is very difficult to get, while slippage is almost impossible to account for due to the fact that historical connection speeds and response times are unknown. Tick data can alleviate the spread concern – as tick data includes bid/ask data – but this is broker specific and can rarely be obtained for any particular broker for more than a few years. If simulations are performed without regard for any of the above – without liquidity data, assuming perfect executions and with constant spreads – then it’s critical to see whether those assumptions really lead to acceptable matches between backtesting and live trading. If any of those assumptions leads to significant problems then the simulations need to be made more pessimistic to align with these increased costs.
Thanks to the fact that we have hundreds of users who trade thousands of trading strategies in their own accounts we have been able to gather a database with millions of trades along with their real entry and exit prices that we can compare with our backtests to see how well our simulations represent the recent past. First of all we can see if our backtesting and live trading logic is indeed identical and second, we can see whether the above issues related with slippage and spread costs do affect our trading in a significantly negative manner. We have analyzed a total of 76,813 signals which have been executed across many different trading accounts. For each signal we calculate the average entry and exit prices – using data from all the trades that were taken due to that signal – and this allows us to estimate how much the entry and exit deviated in a favorable or unfavorable manner.
–

–
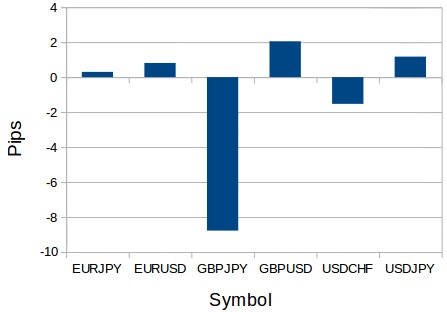
In average our total deviation (open deviation plus close deviation, determining favorability considering trade direction for each case) was -1.37 pips, meaning that on average every trade executed 1.37 pips less favorably than anticipated by our simulations, this can be imagined as paying an addition 1.37 pips per trade in spread costs. The first image in this post shows the results by pair. Here we can actually see that for 4 out of 6 pairs we have actually favorable deviations (EURJPY +0.3, EURUSD +0.81, GBPUSD +2.05, USDJPY +1.17), meaning that the spreads we use in our simulations are probably good estimations for these symbols and the delays in execution we get are either favorable or low enough as not to matter in a significant way. However there are two cases with negative results, the first is the USDCHF (-1.53) and the second is the GBPJPY (-8.78). In the first case the deviation is not very high but in the second we have a result that is tremendously negative, probably accounting for most of the reason why our main average per trade is negative. The reason for the above is both due to the fact that the GBPJPY is much more volatile that the other pairs and because we use a spread of 5 pips for this symbol which is – as shown by the above evidence – most probably too low. Although 5 pips is above the average Oanda market spread for this symbol it does not give enough room for additional losses due to slippage and widening.
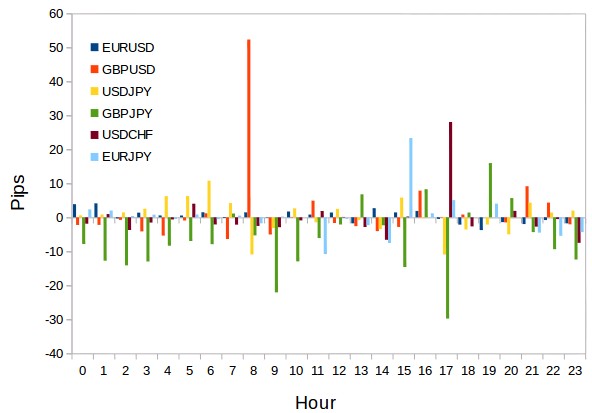
The second image shows the deviations when split by trades opened at different hours. It is evident that all hours are not the same and even for the very negative GBPJPY there seem to be some hours when deviations tend to be positive. You can also see some cases where deviations are extremely positive – for example the GBPUSD trades opened at hour 8 – this is mainly related with the fact that trades opened at this hour have faced positive news as a whole by chance and potentially also faced some important market moving events like the Brexit or the GBP flash card positively. It is however unlikely that such deviations will persist over a significantly long period of time, as they are probably the consequence of these rare events that happened to favor some strategies more than others by mere luck. I would expect these deviations to become lower and lower as a function of time, giving us a much smoother curve after a few years of trading. For this same reason we need to take more time and gather more data before we consider any actions that might involve directly using this information (such as mining systems that trade at hours when deviations are expected to be favorable).
–

–
The above already shows that our simulation spread costs probably need to be increased significantly for the GBPJPY and perhaps only moderately for the USDCHF. It also shows that our execution has been good across the board – on most symbols as a matter of fact – and that higher liquidity symbols show lower deviations than lower liquidity symbols (not surprising since these increases in costs are mostly related with execution delays and spread widening). We have now coded some scripts to perform the above analysis every week so we’ll be able to keep updated tabs on how our systems execute and whether or not our simulations align with those executions. If you would like to learn more about our community and how you too can create your own algorithmic trading strategies please consider joining Asirikuy.com, a website filled with educational videos, trading systems, development and a sound, honest and transparent approach towards automated trading.strategies.


