Our methodology to find supervised machine learning strategies in an automated manner has traveled a rough road from the start. Our first attempt – which started in 2015 – faced significant software based problems that forced us to eliminate all the systems we had mined and start over again and our current effort hasn’t had an easy ride either. Today I want to go through some of the issues our current machine learning portfolio and mining effort are facing and how we plant to tackle these problems to improve the outcomes of our trading strategies going forward. I will talk about some of the issues related with our mining criteria and how these may have caused significant problems in our ML system outcomes.
–

–
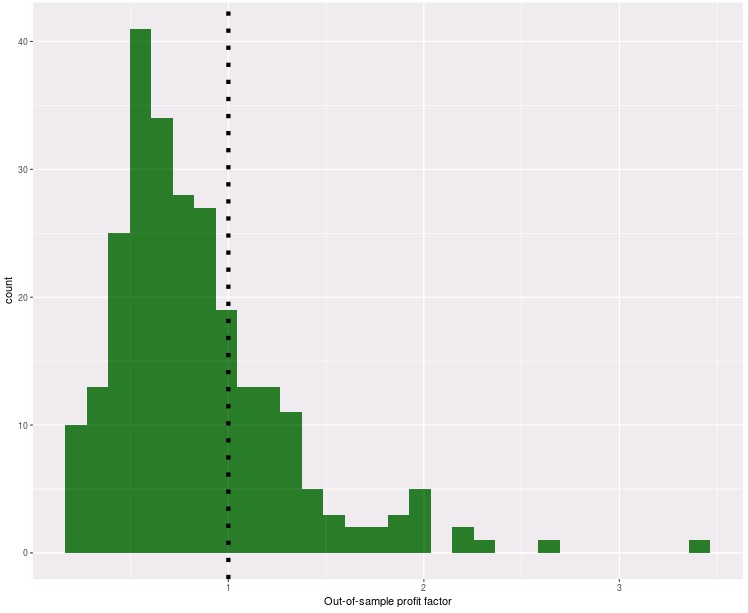
Our machine learning systems haven’t had the out-of-sample success that we hoped they would have. The graph above shows you the distribution of out-of-sample profit factor values for systems that have taken more than 10 trades. With a mean value of 0.84 it seems evident that these systems as a whole haven’t had an overall profitable outcome so far and that only certain strategies have been able to achieve significant amounts of success within this group. It is therefore important to ask ourselves why these groups of strategies aren’t working as they should and what we could possibly do to add systems that have better expected out-of-sample performance outcomes.
One issue we had that contributes significantly to the above result is a problem with the mining of random forest strategies that we did not catch until around 2 months ago. The random forest algorithm we were using in Shark gave significantly different and variable results across two different versions of the library, reason why our mining basically gave us strategies that when live traded – or even when back-tested a few times – gave completely different results. We have since marked all these strategies as having reached a worst case – so they aren’t live trading now – but it’s true that we added them to the repository as a consequence of this issue with random forest strategies.
–

–
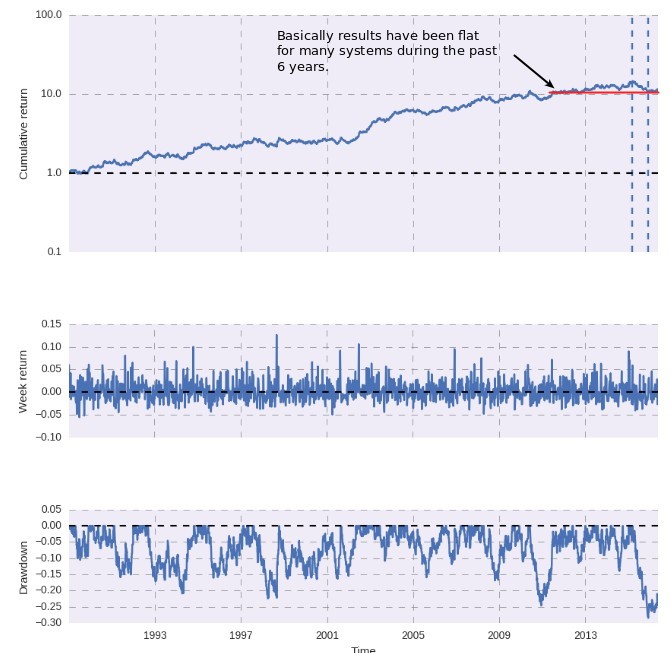
When looking at the other machine learning strategies more closely it seems rather evident that a significant amount of them have had very flat results during the past 6-10 years. This is unlike results in our PA repository where results during the past 6 years do not seem to follow any discernible negative pattern within our mined strategies. For the ML strategies – possibly due to the way in which they try to learn from the market – the past 6 years have become much harder than the previous 24. We use the R² of the entire in-sample period to evaluate system stability but a 6 year flat period in a mainly linear 30 year back-test means that a strategy that has been basically flat during a good chunk of recent history might still have an R² above 0.95.
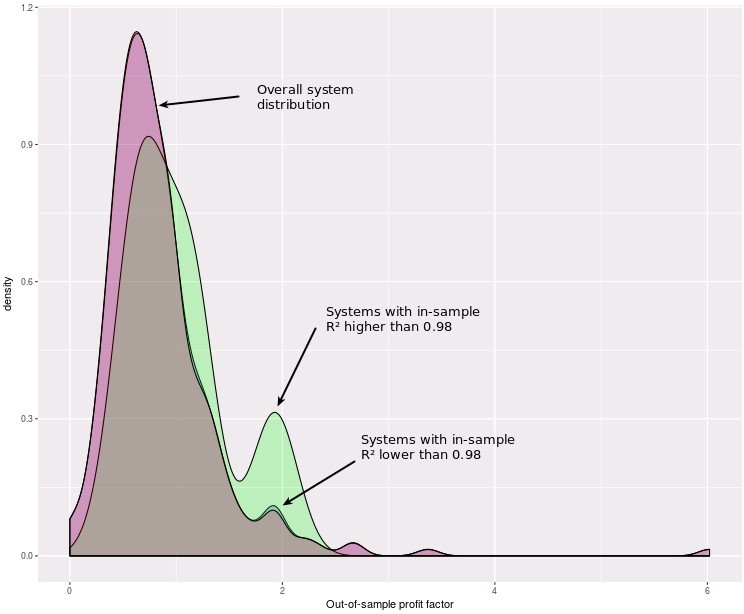
If you look at the density of the out-of-sample profit factors for all systems and those with R² values above and below 0.98 – a much higher threshold than the current 0.95 we use – it seems evident that the profit factor improves a lot when filtering by a higher R². In fact the average out-of-sample profit factor for this group is in fact 1.033, which means that this group has been overall profitable from the start compared to the group of strategies with lower R² values. However although this offers a sense that demanding higher stability for the ML repository under recent market conditions is necessary it really isn’t a good solution since you could still have systems that just have a much more linear result for the first 24 years and then a flat period after that. Increasing the R² filter therefore won’t help too much in this matter as it only improves the problem in some limited number of cases.
–

–
The above shows that what we need is a more effective way to demand continuous stability within financial time series for this repository. This should probably mean coming up with a mechanism for stability evaluation that looks at large chunks of the data – say something like 5 years – to ensure that that all periods contribute at least a given percentage of the overall final return of the series. In essence a rolling window measurement of the last X year profits should never drop below a % of the overall contribution to the final system’s return. This should be more effective than the R² in demanding stability since it should ensure more consistent stability in profits that the R² statistic simply doesn’t care about. If you would like to learn more about our ML repository and how you too can contribute to our community mining efforts please consider joining Asirikuy.com, a website filled with educational videos, trading systems, development and a sound, honest and transparent approach towards automated trading.strategies.


Hi Daniel,
Do you have any ideas why is there a peak around PF of 2?
Also what ML strategies does this analysis include? Also RL?
Thanks,
mac
Hi Mac,
Thanks for writing. The peak around PF 2 could be because of a somewhat spurious correlation between some of the trading systems, I doubt it is more meaningful than that at this point. Also this only includes supervised ML strategies that use Shark, it doesn’t include RL strategies. Let me know if you have other questions,
Best Regards,
Daniel