When we think about price action based trading we think about the making of trading decisions using unprocessed information from a given tick or open/high/low/close (OHLC) chart. For most people this entails using comparisons of the form A-B > X where A and B are points within a price chart and X is a value expressed in absolute price units. Today I want to introduce another way of looking at price action based data that uses angular data to derive information for trading. I will go into why this might be superior to using direct point to point comparisons in charts and why it does not constitute a significant deviation from the concept of price action based trading. We will learn how to calculate this new data and how to potentially create systems using this new information.
–

–
As I mentioned above you have access to mainly one type of comparison when you’re looking at the pure usage of points within a price chart. You can compare two values against a given absolute price unit quantity (X) and with this you can derive both the relative positioning of two points within a price chart as well as get an idea of how separated these two values are. Alternatively you can make X=0 and you get a simple A>B comparison where you only get a notion of whether one point is higher or lower than another within a price chart. When using this type of comparison it is useful to express X as a percentage of A as well in order to make the comparison indifferent to the actual absolute magnitude of variations within the chart. This way of making comparisons is extremely powerful and can yield an extremely large array of systems given even only a small two rule space (A-B>X and C-D>Y) but you can potentially do better by using a comparison system where information is even more compressed.
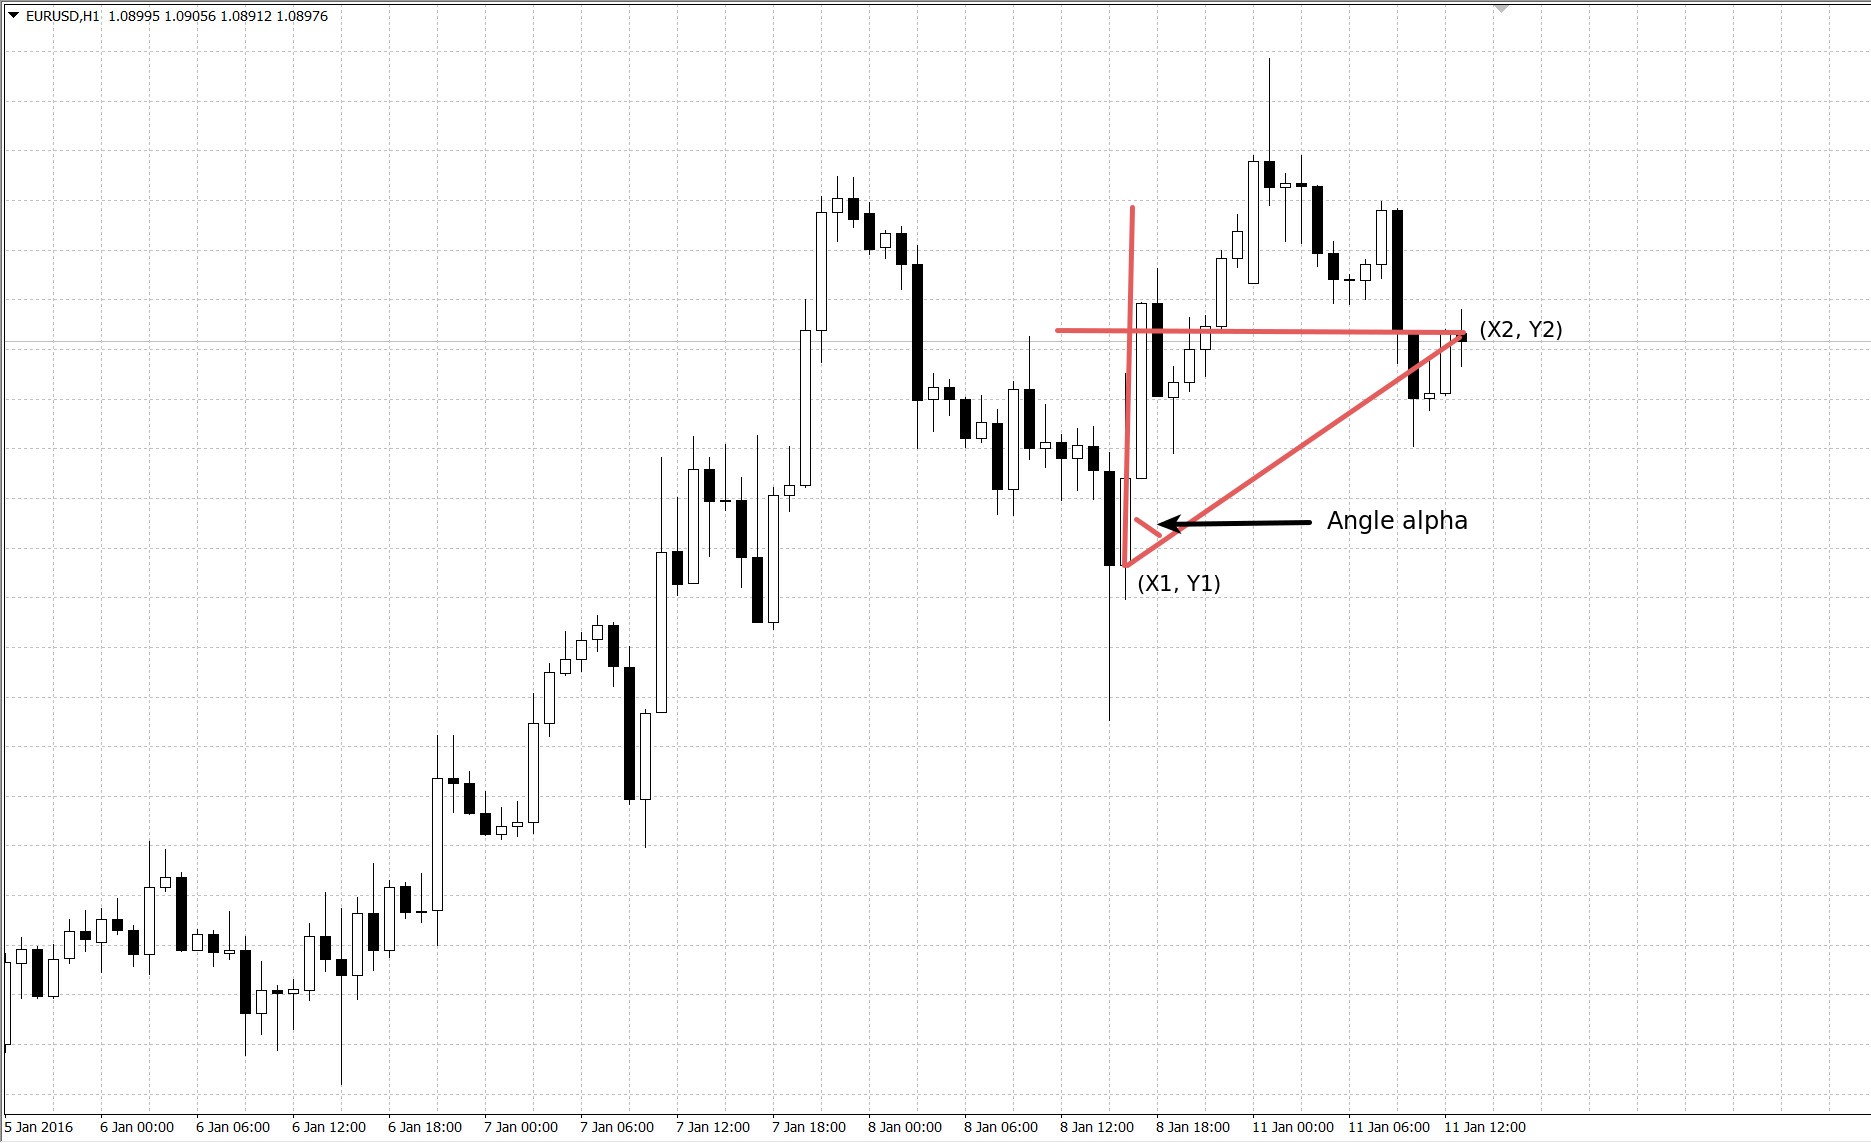
Given that information from the time axis is not used explicitly within the above comparison method I became curious of whether we could develop a more compressed comparison method for price action based trading where we take information from the horizontal axis into account. With this in mind I had the idea to create an angle based system for comparisons where we derive the angle created by the triangle made by the interection of the horizontal and vertical lines coming from two points plus the line that joins them together. The image above shows how this would work between two points. If we have points (X1, Y1) and (X2, Y2) then angle alpha is made by a vertical line in X1 and the line that joins the two points.
–

–
To calculate the value of alpha we can use some basic trigonometry. Since Tan(alpha) is equal to Y2-Y1 over the vertical X2-X1 we can obtain the angle by calculating the ArcTan((Y2-Y1)/(X2-X1)), since the horizontal axis is in time units we can avoid problems from things such as week-ends by expressing it in terms of 1M-bars-between-values instead of simply absolute time units. We can also express the vertical axis in terms of percentage points to make it normalized regardless of symbol or timeframe. If we have two points separated by 5 bars with a difference of 0.1% between them – with the second point higher on the chart – then the value of the alpha angle would be 1.14° or 0.02 radians. If the second point was below and not above this angle would become negative and would be -1.14°.
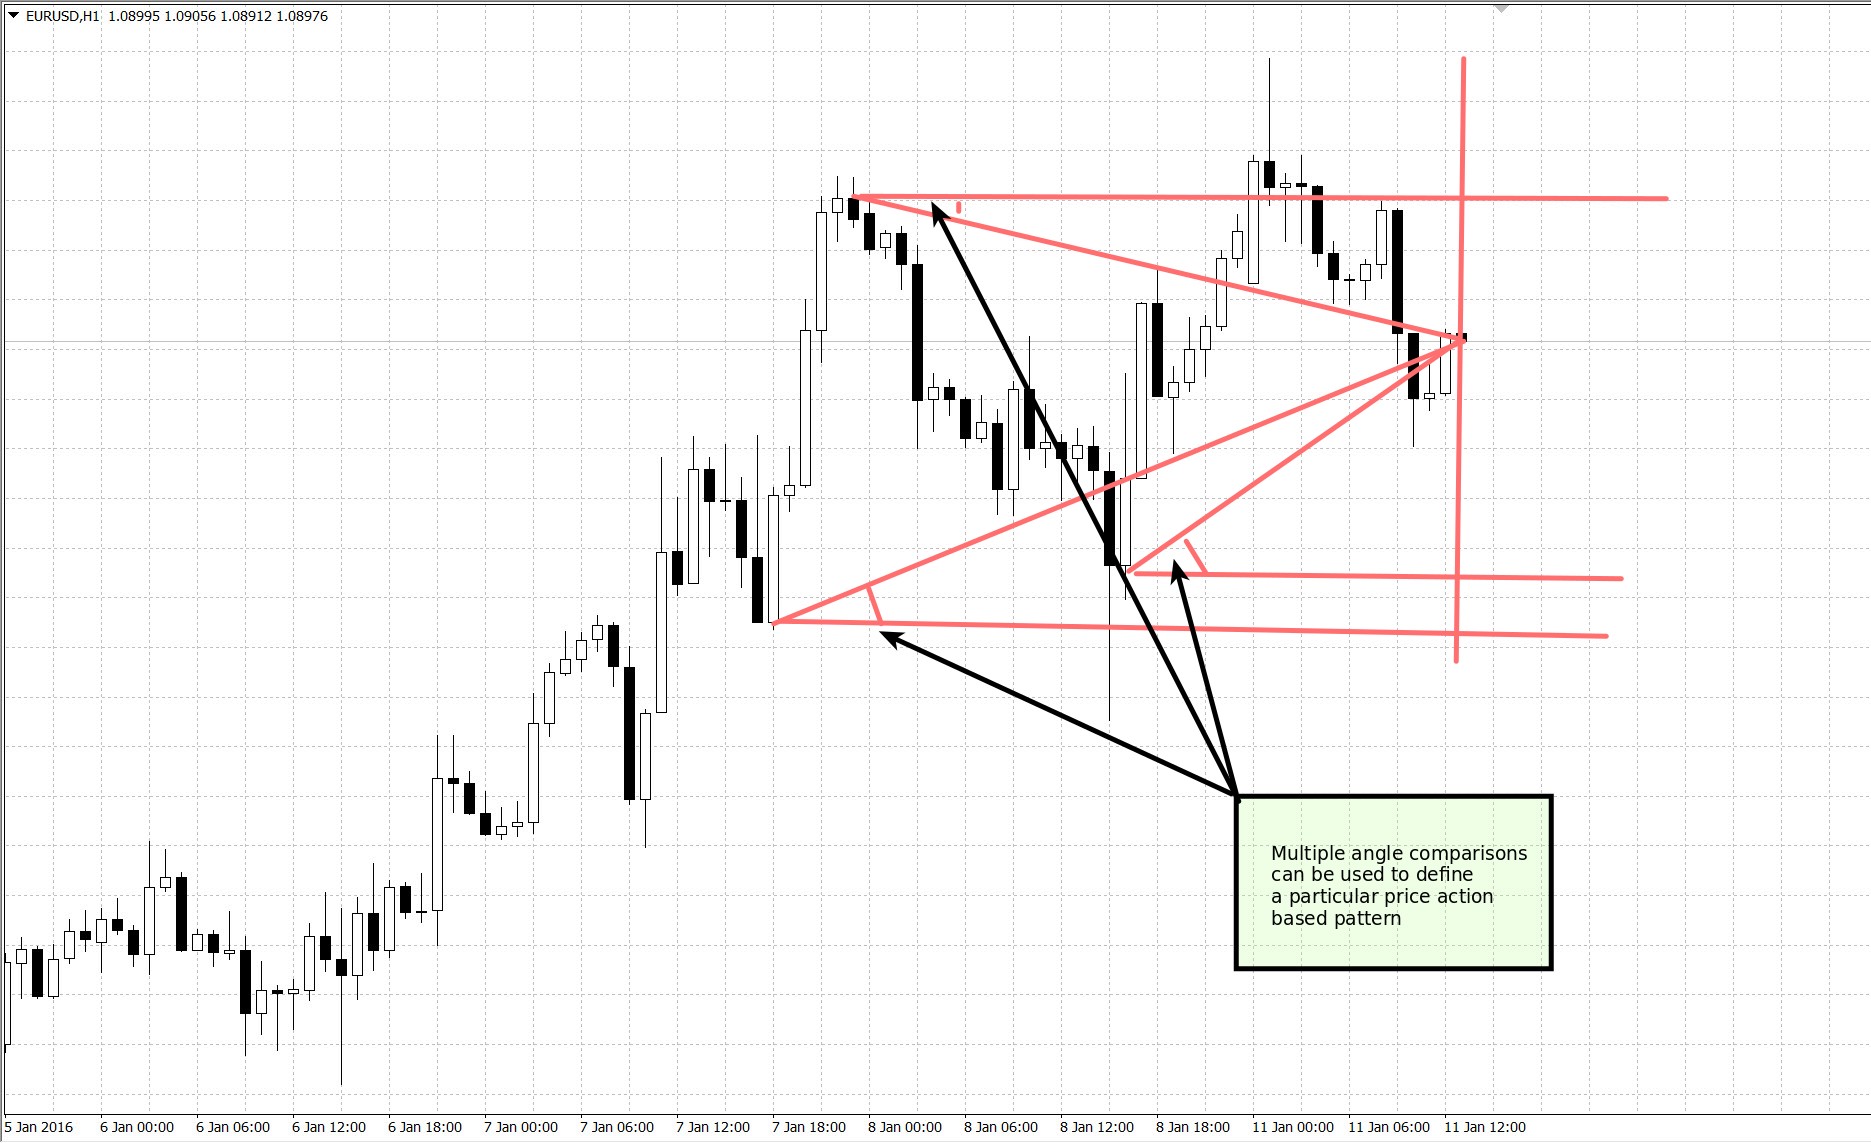
Angles are particularly useful because they are akin to an oscillator in terms of price action. They are naturally limited to values between 90° and -90° and will give values in this range regardless of how much separation you have between bars in either time or price values. This fact also generates a compensation between the magnitude of a movement and the separation between price values in time. For example an angle of 80° would always imply a dramatic increase in price on a chart although this would need to be much bigger on a 1D chart compared to a 1H chart (because on a 1D chart you need a much bigger difference in the vertical axis since your horizontal axis distance is much bigger). By using different angles we can start to derive patterns in a way that defines price action based movements in a manner that is consistent regardless of the timeframe we’re looking at. Since we measure the horizontal X distance in terms of 1M bars this means that our price patterns will look the same in terms of angles, regardless of the timeframe we are using.
–

–
Angles are therefore a very interesting descriptor to be used in price action based systems and potentially in machine learning systems. Angle comparisons of the form angle(A, B) > α where α is a value between 90° and -90° and A and B are two points within a price chart can lead to complex pattern formations that can be used to create trading systems. In line with price action based comparisons of the form A-B > X described in the beginning of this article, using angles can lead to complex strategies by using only a few rules. Adding to that angles more explicitly contain information relative to the time axis, which is not present in the A-B > X comparison, which could lead to the description of much richer trading patterns. I will try using angles in trading system mining and will post about my results on a future article.
If you would like to learn more about trading system creation and how you too can create your own trading systems please consider joining Asirikuy.com, a website filled with educational videos, trading systems, development and a sound, honest and transparent approach towards automated trading.


Hi Daniel,
Really interesting article! This is indeed an elegant way of including an aspect of time into price action based systems.
Could you please clarify what you mean by expressing the y-axis in terms of percentage points. What would be the reference point? I’m guessing the most recent data point would be 0.0%, but then how would you deal with multiple angle comparisons?
Best regards,
James
Hi James,
Thanks for writing. You would always make the reference for the percentage for each point the most oldest point from the two point pair. So say you have a point at 1.1232 and then a point at 1.3245 you would express the difference as (1.3243-1.1232)/1.1232, just as you would generally express a return value. Let me know if you have other questions,
Best Regards,
Daniel