This year’s most important currency market event is coming up this week. The brexit – where United Kingdom citizens will decide about whether the UK should remain within the EU or not – is scheduled to take place on June the 23rd. As Forex traders we will need to decide how to face this event and prepare for the eventual volatility that this event might bring. Today I want to share with you some historical hourly volatility analysis of GBP instruments using data from 1986 to 2016 that might be able to shine some light into what we could be expected from the GBP the day of the Brexit. Although it is in practice impossible to predict what the exact reaction will be the historical volatility that the GBP has seen under both foreseen and unforeseen events might shine some light into the type of movement that we should expect.
–

–
Looking at the historical return data for the GBP/USD we can see that the most volatile hours for both long and short moves happened in the 1980s. This is not surprising as pairs used to trade in a much more volatile manner when liquidity in the markets was lower. The two hourly candles with the highest volatility, that happened on 25-Sep-1989 (+2.38%) and 15-Jan-1988 (-2.35%), do not seem to match any world changing events but are most probably aligned with some unexpected financial news release, such as a surprise news report, meeting or rate change. If we faced this type of change the day of the brexit we would see a candle of around +/- 340 pips depending on the direction of the movement. Given that the event is scheduled and the result will arrive in waves as votes are counted we will most probably not see significant gaping – as we saw when the SNB removed the peg – but we would see large volatility.
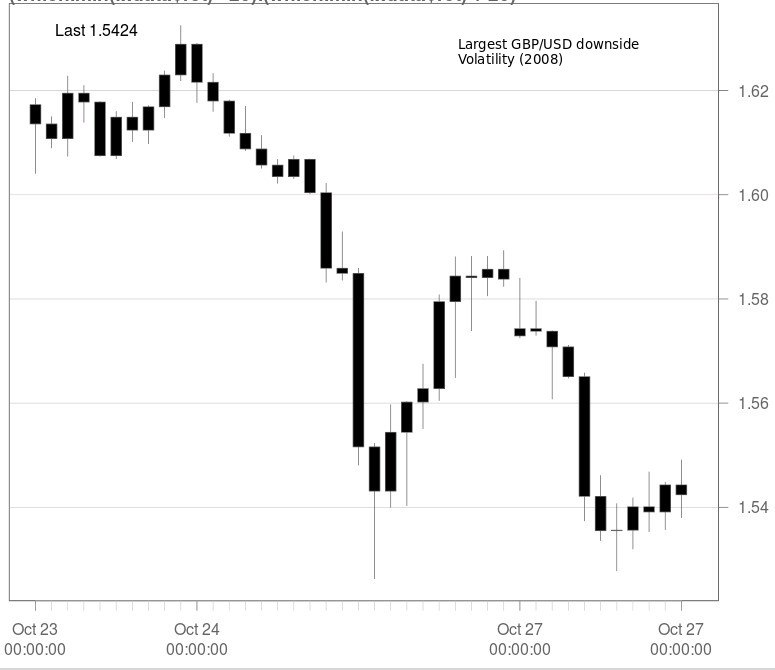
If we decide to look at the past 50,000 trading hours we can get a better view of what volatility extremes have been like under recent market conditions. The largest volatility during this time for the GBP/USD happened on 18-Mar-2009 (+1.79%) and 24-Oct-2008(-2.10%). This shows the rather common behavior we have seen during the past 10 years where USD bullish movements are in general more aggressive than USD bearish movements, a consequence of the risk-on nature of the USD favorable scenarios. This dates did align with easier to find news, as they happened during the internet age. In 2009 the event matches a clear stock rally (risk-off behavior) as you can see here sparked by the Fed, while the 2008 event matches a risk-on event during the US financial crisis (see here). If we faced volatility like this today it would mean a similar scenario compared to the extremes in the 1980s, perhaps just a bit less extreme with the volatility probably going into the 310-320 pip range.
–

–
Of course other more volatile GBP instruments are bound to see much more extreme cases. In the case of the GBP/JPY the largest volatility towards the upside happened on a different date, 31-Oct-2011 (+3.69%) while the largest volatility towards the downside happened in the same date as for the GBP/USD with a net movement of -4.25%. Given the current GBP/JPY price we would expect to see a movement in the order of 630-650 pips if the volatility during the Brexit matches the most extreme volatility seen by this pair during the recent past.
Note that the above volatility is based on close-to-close measurements (returns) as I wanted to avoid missing gaps within the search but we can also take a look at low-to-high comparisons to see if we can find something of a greater magnitude. Indeed the results point to the same days as for the largest short movements although the magnitude is indeed a bit higher with a maximum of 2.4% instead of the 2.10% we had seen for the GBP/USD. The value also increases for the GBP/JPY and the maximum volatility shifts to 06-May-2010 where the highest high-to-low candle covered 5.05%. It’s not surprise that this day has such a large high-to-low distance on the GBP/JPY as this was the day of the flash crash.
–

–
Given the historical volatility we have seen in the past and the fact that the Brexit is an announced event – where the outcome is revealed gradually – it does not seem too probable that historical volatility will reach new records. If we trust the historical precedent then this event might generate a volatility spike in the 300-400 pip range for the GBP/USD and of around 600-700 pips on the GBP/JPY. This volatility spike will happen once the result is known with mathematical certainty although people will possibly start making bets before, when the outcome is largely probable but still not yet certain. In any case we will be trading the Brexit at Asirikuy using our massive price action based portfolios, hopping to catch some profit as we trade the event. If you would like to learn more about our repository and how you too can trade massive Forex trading system portfolios please consider joining Asirikuy.com, a website filled with educational videos, trading systems, development and a sound, honest and transparent approach towards automated trading.strategies.


