Recently I talked about a new statistic I developed for the comparison of different trading strategies, the losing period overlap index or LPOI. During this past week I have been working on improving the calculation to make it significantly more efficient from a computational stand point and today I have released a new qqpat update that introduces the ability to easily calculate and plot the LPOI result for a given set of return series. Today we are going to talk a bit more about the LPOI and how you can use the qqpat Python library to easily calculate a heatmap for your trading strategies and compare it with a plotted heatmap of the traditional Pearson correlation measurement. You can download the script and sample data here to reproduce the results in this post.
–
import pandas as pd
from pandas_datareader import data
import datetime
import csv
import matplotlib.pyplot as plt
import qqpat
from dateutil.relativedelta import relativedelta

def lastValue(x):
    try:
        reply = x[-1]
    except:
        reply = None
    return reply

system_list = ["sys0","sys1","sys2","sys3"]

for index, system in enumerate(system_list):
    tradeTimes = []
    tradeBalance = []
    with open(system + ".txt", 'rb') as csvfile:
        reader = csv.reader(csvfile)
        for idx_data, row in enumerate(reader):
            if idx_data > 0:
                tradeTimes.append(datetime.datetime.strptime(row[3], '%d/%m/%Y %H:%M'))
                tradeBalance.append(float(row[10]))
        if index == 0:
            data = pd.Series(data=tradeBalance, index=tradeTimes).resample('D', how=lastValue).pct_change(fill_method='pad').fillna(0)
        else:
            data = pd.concat([data, pd.Series(data=tradeBalance, index=tradeTimes).resample('D', how=lastValue).pct_change(fill_method='pad').fillna(0)], axis=1)

data = data.fillna(0.0)

analyzer = qqpat.Analizer(data, column_type='return', titles=system_list)

print ""
print "CORRELATION TABLE"
print analyzer.get_correlation_values()
print ""
analyzer.plot_correlation_heatmap()

print "LPOI TABLE"
print analyzer.get_lpoi_values()
print ""
analyzer.plot_lpoi_heatmap()
–
The LPOI is different from regular correlation measurements in that it does not care about the correlation of positive returns – whether two strategies make money at the same time – but it only cares about whether their losing periods overlap. The LPOI value between two systems is therefore simply the number of losing periods that overlap between both systems divided by the maximum possible overlap (the number of losing periods that is biggest among the two systems). The LPOI value of a system with itself is always 1 – all losing periods overlap between a system and itself – while it will oscillate between 0 and 1 for two different trading strategies.
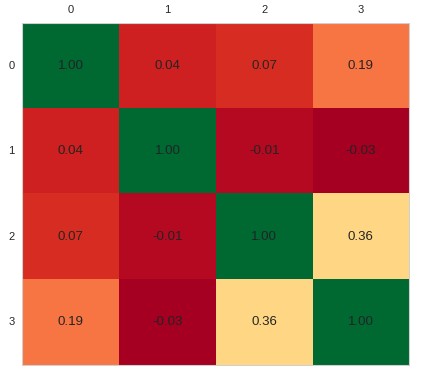
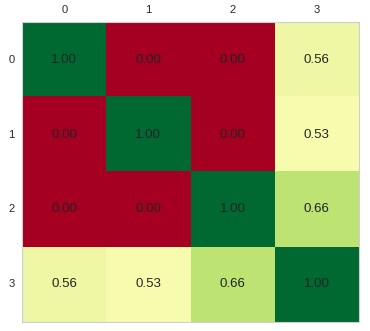
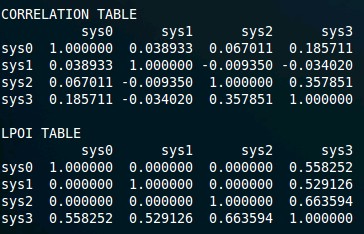
In qqpat there are two functions you can use to play with the LPOI, there is a get_lpoi_values function that returns a pandas dataframe containing the LPOI values for all the systems in the input dataframe and there is a plot_lpoi_heatmap that plots a heatmap of the LPOI pandas dataframe. Both functions calculate the LPOI using the monthly returns from the input series as otherwise the calculation would be too expensive. As with correlations the monthly return LPOI gives the most information as finer grain or coarser timeframes are generally harder to interpret. You can see the sample code above where data for 4 systems is loaded into qqpat and these functions are used to calculate and plot the LPOI. The correlation heatmap and dataframe are also calculated and displayed so that you can compare both.
–


–
The images above show you what you will obtain for the correlation and LPOI heatmaps with the above script. While systems 1-3 have both low correlations and LPOI values it seems clear that the overlap with system 4 is vastly located over losing periods. While the correlation analysis reveals a value that might be considered acceptable – with the maximum correlation value of 0.36 – the LPOI instantly shows that there is a 66% losing period overlap between system 4 and system 3 and a more than 50% losing period overlap with the other systems. With this information we would try to avoid trading system 4 with the other systems as it is clear that despite the relatively low correlation value the correlation manifests itself mostly as a match between the losing periods of this and the other trading strategies.
With the above script it is now easy for you to also use the LPOI in your system analysis. Although its calculation is still far slower than the calculation of correlations – since it uses comparisons that cannot take advantage of linear algebra as efficiently – it can be calculated very fast if the number of systems is not too great. The calculation time for the LPOI grows as a function of N² meaning that it can quickly get out of hand if the amount of systems is too big. Benchmarking the LPOI showed that for 3000 systems it would take a few hours to get the LPOI matrix while a correlation matrix for this number of systems would just take a few minutes to calculate. This is the best performance I could get but if you manage to get faster times feel free to contribute your code in the qqpat github page.
–

–
The LPOI is now a part of the qqpat library and therefore easily accessible to anyone who wants to do financial time series analysis using python. Using this LPOI implementation you can enhance or at least compliment your present portfolio building efforts. The LPOI provides a different and more relevant vision compared to regular correlation analysis since it focuses on losing periods which are the most interesting for us as traders. If you would like to learn more about qqpat and how you too can use it to do financial time series analysis please consider joining Asirikuy.com, a website filled with educational videos, trading systems, development and a sound, honest and transparent approach towards automated trading strategies.


It would be interesting to know, in how many percent of all cases there would be a divergence between correlation and LPOI values. In your example the pair with the lowest correlation also has the lowest LPOI values. Same applies to highest value. This suggests, as you’ve already pointed out, that LPOI could rather complement than replace correlation calculations. Perhaps it could be used to improve MC simulations. Other ideas?