During the past few months I have talked about how we can attempt to predict the next 3 months of out of sample results for a trading system using the last 3 months of results. I demonstrated how you can use a database constructed using thousands of examples using both system characteristics and past system performance statistics to obtain statistically significant results in predictions. Today I want to expand on this idea even further in order to show you how we can get similar accuracy in predictions without the need to use any system characteristics or performance by using examples that basically rely on the market conditions that were present within each symbol during the recent past.
–

–
This year I wrote an article about market conditions and how difficult it can be to define this concept in a manner that is both quantifiable and useful. Since system success can sometimes be related with some set of market conditions – some systems might work better when the market shows different degrees of permanence, mean reversion, etc – it is interesting to consider whether we can actually find some relationship between past market conditions and future system performance. This is what traders usually refer to as a “switch” or a mechanism that can start or stop trading systems according to some idea of how systems are expected to perform given how the market has behaved in the recent past. Of course this idea is extremely difficult to achieve and using naive interpretations of market conditions – things like the ADX, volatility or MA positions – usually yields very poor results.
Chaos related properties seem to achieve the most success when attempting to describe market conditions. Measurements like the hurst exponent, approximate entropy and fractal dimension can all be related with time series properties that measure past to future relationships in time series data so they can in some ways quantify how the past data relates with the future data. Since our trading systems’ success depends primarily on this factor – how the past relates to the future – it is perhaps interesting to think that the chaos related properties can – all by themselves – help us predict whether a system will be successful or not.
–

–
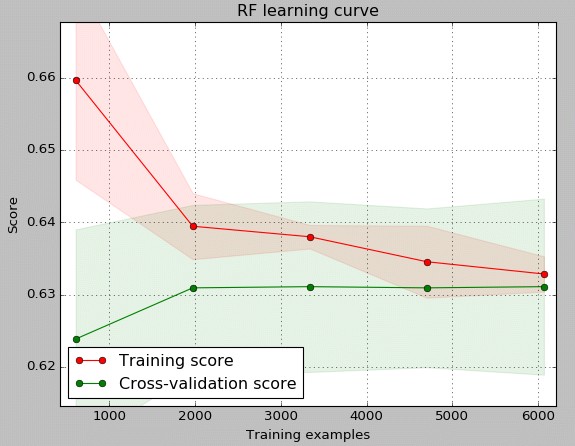
With the above in mind I saved a database containing examples where inputs consisted of the fractal dimension (fd) and detrended functional analysis (dfa) for six Forex symbols for three months and the predicted output consisted of a binary that indicated whether the system was or was not profitable for the subsequent three months. After that I constructed a machine learning model using a random forest classifier that trained using a randomly chosen subset of data and then attempted to predict whether future performance was positive or negative. The learning curve for this model is showed in the first image within this post, as for general complex problems when using this type of classifier the training and testing errors tend to converge as the number of examples increase.
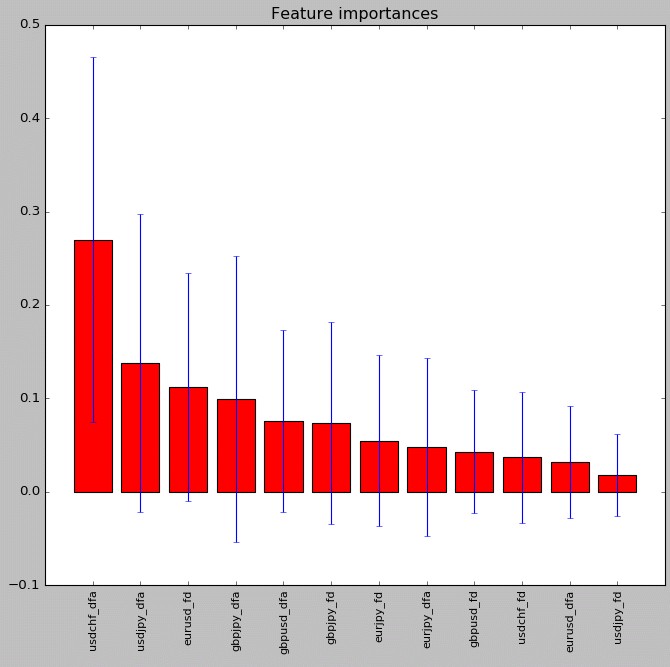
The second image shows the relative variable importance in the model. In this case the highest importance was assigned basically to dfa values for the USDCHF and the USDJPY while fractal dimensions in general had a lower importance. Repeating the model generation always gives similar results in terms of giving the dfa more importance against the fractal dimension but symbol distribution values can indeed change significantly. This is most likely because there is some correlation between the dfa/fd values for the different symbols so for example the positions where the usdchf values are located are sometimes exchanged for the values for the eurusd. Nonetheless the machine learning algorithm training is always able to construct a successful model that is able to achieve statistically significant improvements in testing sets.
–

–
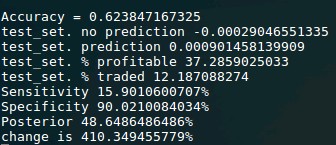
The above image shows the usual measurements obtained when using this model for predictions on a testing set. The accuracy is usually above 60% but the improvement in the returns (above “change”) varies significantly from around 50 to even 1500%. As for previous cases with similar success rates the sensitivity of the model is low while the specificity is significantly high, this usually gives the largest “change” value although sometimes aiming for a higher sensitivity by tuning the prediction threshold value can help reduce model variance. These results are encouraging because this means that predictions of OS success are most likely possible without using any information from the systems except how their performance relates to recent market conditions as measured by chaos variables. Of course the above is just a preliminary test and is no indication of whether this method will succeed in OS predictions going forward, for this we would have to test this in live trading for which more refinements are still needed.
If you would like to learn more about our trading repository and how you too can trade thousands of price action based trading strategies please consider joining Asirikuy.com, a website filled with educational videos, trading systems, development and a sound, honest and transparent approach towards automated trading.strategies.


