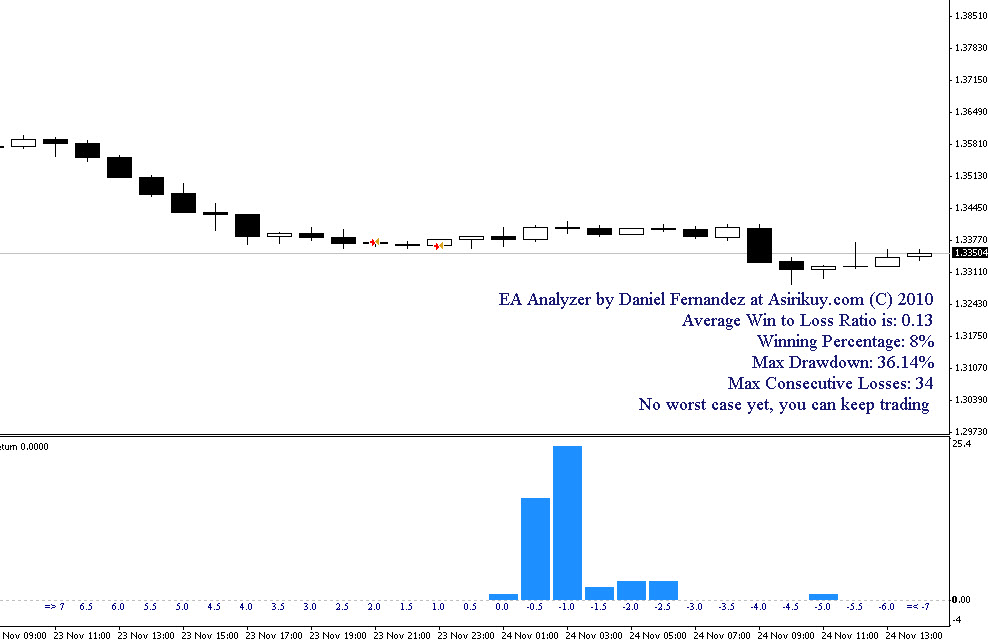
On yesterday’s post I talked about the evaluation of trading systems and how knowing the distribution of returns and how it compares to the distribution of long term simulations would give us an idea about the overall compliance of an EA with its long term statistical expected characteristics. On this post I also talked about how we needed a tool in order to analyze these distributions automatically as well as to warn us when our system went past the performance worst-case thresholds established by Monte Carlo simulations. On today’s post I will share with you my advances on this matter, a Metatrader indicator I have developed to help us analyze our trading systems “on the go” greatly facilitating the analysis and insights we have into our Asirikuy systems.
In Asirikuy we have developed several tools to help us better analyze and understand our trading systems. Thanks to several members and their efforts we have been able to develop software to help us deeply analyze back-testing results as well the results of portfolios resulting from the joining of several different Asirikuy systems. However one problem that remained elusive was the continuous evaluation of our trading systems in an easy fashion. The problem is that Asirikuy systems run within a portfolio can have their true results “obscured” by the profitability of other systems and their true maximum draw down and consecutive losing counts can become difficult to determine from the simple account statements.
–
Of course, there were several solutions to solve this problem. One of them is to add the accounts to myfxbook since we can actually determine things such as InstanceID specific draw downs and the like using this platform. However since the magic number of Asirikuy systems is changed every X time when balance resets are carried out (these are simply redistributions of assigned portions of the account between the systems every now and then) solutions such as myfxbook become obsolete as taking into account several magic numbers to analyze for draw down, consecutive loses, etc, becomes necessary.
A few other problems arise from the fact that the above “web reporting” solutions do not offer us the ability to analyze systems in as much depth as we want. We cannot get frequency distributions of returns, we cannot perform statistical tests against long term historical distributions and we cannot get warning or messages related to any “worst-case” criteria we may want to establish. Because of all these limitations it becomes obvious that we need to build a more custom solution that allows us to evaluate Asirikuy systems “on the go”, being able to take into account one or many different instance IDs to evaluate the current trading outcomes of single systems across resets, whole portfolios, etc.
After working a lot during this week and last week end on this solution I have come up with a new indicator for the Asirikuy community. This indicator which I simply called “EA analyzer” displays convenient “real-time” information about a given account or portfolio, constantly comparing this information to the stored “worst-case” parameters of the different Asirikuy systems. The indicator displays important information such as the maximum draw down, maximum consecutive loses, winning percentage, win to loss ratio and whether or not the system is currently complying with its expected Monte Carlo thresholds. The indicator is also efficient and consumes little resources. The above image shows the indicator loaded on a demo account in which I opened and closed many trades at different lot sizes to show how the distribution of return graph and reporting works.
I decided to create this analyzer as an indicator mainly for two reasons. The first is that you can run it alongside any expert advisor you are trading without opening additional charts and the second, that running it as an indicator allows me to create an additional window in which I could create a pretty chart to display the current frequency return distribution of the desired account/system/portfolio. The Asirikuy EA analyzer displays a graph on a separate windows showing this distribution of trades in 0.5% intervals from -7 to 7%, trades that exceed these values are placed within the last classes which are “open” to trades which are higher than 7 or lower than -7%.
I am currently in the process of building the Monte Carlo threshold database for the indicator but the first initial draft displaying all the above information will be available for Asirikuy members from this week end. If I can get all the simulations done we might also be able to have the system include all the Monte Carlo thresholds from the first release :o). If you would like to learn more about system evaluation and how you too can learn to evaluate systems to know when you should stop trading them please consider joining Asirikuy.com, a website filled with educational videos, trading systems, development and a sound, honest and transparent approach to automated trading in general . I hope you enjoyed this article ! :o)


