As you know during the past few months I have been focusing on the development of Neural Network (NN) trading techniques using images as inputs. Last week I posted my first 25 year back-testing results, suggesting several improvements that could take this NN technique even further. Today I am sharing with you some additional results from my efforts, particularly how this NN system has now reached a level of back-testing profitability superior to all my previous NN based systems. I am going to comment a little bit on how I managed to improve results so much and I will also show you some very interesting results that are obtained with this NN strategy that other systems are not able to achieve — mainly multi-instrument profitability. Let us now go into the world of image NN and what my results have told me up until now.
Last week I obtained the first reproducible long term profitable results for my NN image technique system (now called Tapuy). The system uses chart images as inputs and then attempts to predict next day directionality based on a histogram of possible trading outcomes. The use of a histogram as an output was fundamental to achieve these results as well as the modification of the image inputs in order to make them clearer (lines instead of candlesticks). After this achievement I then tried to improve on the results by testing different canvas sizes, scaling techniques, training sample sizes, etc. My tests showed – very interestingly – that images with larger numbers of data points showed worse results, even if the canvas size was also increased while keeping the data points constant and increasing the canvas size yielded almost the exact same output (although computationally much slower). These results agree with some of my previous NN research that shows that about 2-4 days of data are optimum when attempting to predict the directionality of the next day. Systems such as Sunqu and Paqarin never benefit on using more data points so it was actually good to see coherence here.
–

–
When this was clear it was easy to take a step in the other direction and test whether simpler models could yield better results. In order to do this I shrunk the image size to 15×15 pixels and used just 5 data points to train the NN on at least 50-100 examples after each trade. The result was a much cleaner equity curve that achieved higher profitability, increasing training epochs on this setup also increased profitability significantly until a point was reached where profitability started to decline (when overfitting starts to happen). Using larger numbers of examples didn’t yield better results and using less pixels on the image also generated worse accuracy in the predictions. Indeed this point seems to be the best compromise between computational demand and profitability with larger canvas sizes not increasing profitability while greatly increasing the computational cost (as this scales exponentially with canvas size).
After improving the results with this change I then proceeded to change the output histogram structure (making it smaller) and redistributing the classes, achieving an important boost in system performance as well. The result was an equity curve that is better than Sunqu’s and much better than the initial Image NN implementation I showed you last week. As a matter of fact this back-testing profitability is now high enough to consider live trading, bringing the Tapuy trading system to a new level. The Tapuy trading system has also been released on the unstable branch of the F4 framework, allowing Asirikuy members to play, test, modify and contribute to the development of this image NN trading technique. It is worth remembering that the source of all our systems is fully available to members so that we can further develop and improve our system implementations in a community environment.
–
–
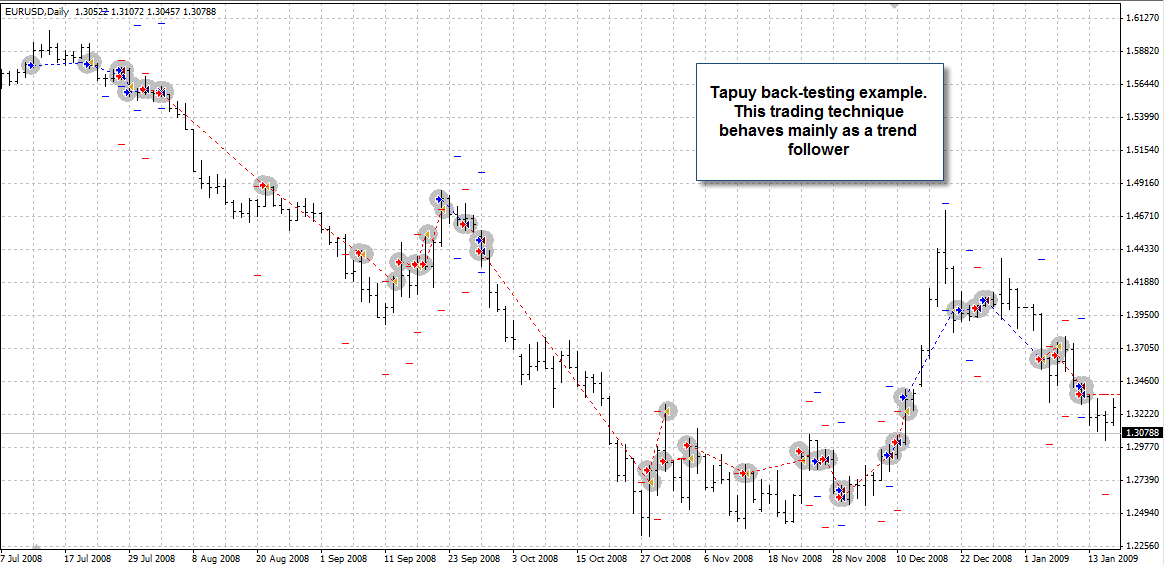
Tapuy – contrary to what Sunqu does – behaves mainly as a trend following system that attempts to follow long term directionality. As you can see on the image above, Tapuy always attempts to follow the trend and even holds to some trades for weeks before closing the positions. During these times Tapuy actually makes a prediction on everyday but avoids closing the trade as the prediction remains coherent (same directionality is predicted). Within consolidation periods Tapuy becomes hesitant and only makes profits when larger ranges develop and some directionality can be seen. However it is worth mentioning that Tapuy is also not strictly trend following as it sometimes does act in a mean reverting manner, particularly when a trend has faced a significant fast extension (so the NN has learned that this graphical pattern may lead to a reversal). how to order disulfiram online It is also important to remember that Tapuy is retrained on every new day, so this 25 year back-test is effectively entirely out-of-sample testing of the NN logic.
Finally I would like to also share with you some exciting results of Tapuy on the GBP/USD (exact same parameters for NN predictions) showing that this training technique is indeed much more powerful than my previous NN developments. As you can see the back-testing results for the GBP/USD are far less profitable than for the EUR/USD but they are in fact profitable through the 25 year test. This shows that the NN technique is able to cling to some fundamental aspects of the market on these pairs, allowing us to adequately adapt our trading on both of them. Granted, these results are not good enough for live trading on the GBP/USD but they do show that there is the possibility to have better results on this pair upon further improvements. Results for other pairs are also interesting, but only the USD/JPY achieves similar results to the GBP/USD. I am also interested in studying how the EA behaves on the USD/CHF, to see if it is able to properly survive the SCB interventions in 2011.
–

–
Right now I have a few ideas to improve Tapuy further but some ideas – such as a lack of automatic scaling – have already proved to be of little help in improving results. Going forward I will start experimenting with colours and different time frames to see if I can get even better results than the ones currently showed by this system. However I have to say that Tapuy is now our best NN trading technique, showing that the idea to use images in the training of neural networks in Forex is indeed a very good one (as you know this was not my idea but taken from an academic paper on the subject — see my previous posts on image NN). I have the feeling that we have only touched the tip of the Iceberg and great new improvements are yet to come. If you would like to learn more about neural networks in trading and how you too can implement a constantly retraining system based on FANN please consider joining Asirikuy.com, a website filled with educational videos, trading systems, development and a sound, honest and transparent approach towards automated trading in general . I hope you enjoyed this article ! :o)


This is great! :)
I have a few questions :
It looks to be 100% of the time in the market?
From the article, you say it avoids closing the trade as the prediction remains coherent (same directionality is predicted), but I see in the chart a couple of places where it closes a trade and re-opens on in the same direction and on the same bar, is that correct?
Also, on some bars, it seems to open both a long and a short position, why is that?
Thanks for the explanations :)
Hi Bruno,
Thank you for your post :o). Right now the strategy is in fact 100% of the time in the market, introducing committees or entry thresholds to prevent this is also a point for potential improvement although right now I haven’t had much success with it. About the “trades on the same bar”, etc, this happens because you’re looking at an MT4 chart while the system acts on the internally refactored data provided by the F4 framework. When looking at entries on the refactored bars you will see that there is only 1 entry per daily candle. It is always important to remember that the F4 framework does NOT act on candles with the same structure as the ones you see on your charts but on internally refactored data that has been modified to account for GMT shifts, weekly starting/ending cutoff values, etc. I hope this answers your questions :o)
Best Regards,
Daniel
Thanks Daniel!
And what about the closing and then re-opening a trade in the same direction?
(ex. on Aug-21, ~Sep-6, Oct-28, etc…)
Best regards :)
Hi Bruno,
Thank you for your reply :o) Those I will need to debug a bit to see what’s going on! I’ll include any fixes on future updates. Thanks for noticing these issues,
Best Regards,
Daniel
Thank you for sharing your development experiences regarding Tapuy. Wonderful effort Daniel. It’s amazing to think a 15×15 pixel picture does the trick. Very fortuitous for our computer CPU’s :-).