As many of you may know, my vision of trading does not focus on the next 6 months or 1, 2 years but on achieving profitable trading during the next 10-20 years and hopefully even further. In my quest to develop a methodology for successful long term trading, a question I have always asked myself is what the best way to select trading strategies for long term success actually is. If you had to select a strategy right now that you would absolutely have to follow during the next 10 years, how would you choose such a system? Would you take a system that has been profitable for very long time ? Would you choose a system with low drawdown, high profit, high Sharpe ratio ? Today’s post focuses on attempting to answer this question by looking at what would have been successful in the past, particularly we will look at what in-sample selection methodology would have worked if you had been asked this exact same question in 1999, to trade the EUR/USD during the next 12 years.
Let’s suppose you are a fund manager in the year 1999 and you have been asked by your group of select clients to find a single parameter-less price action based daily system that the fund will be trading during the next 12 years on the “new and shiny” EUR/USD currency. Your clients want to have a very high probability for profit and they don’t want any surprises (meaning that they want something for which there is a high chance of past performance matching future results). Scratching your head, you walk into the office and wonder how you can actually select a strategy that is robust – having a high chance of future positive performance – with the minimum possible downside risk. Since you refused to buy that magic crystal ball the year before, you have nothing but your analytical skills to get you out of this problem. What is the best way to make this selection? Hint, the most intuitive things are the most prone to failure.
–
–
By using the DEM/USD data from 1986-1999 and Kantu – our price action based strategy generator at Asirikuy – I have created thousands of in-sample profitable and symmetric systems and analysed the in-sample statistical characteristics that profitable systems in the out-of-sample part (2000-2012) actually have in common. To my surprise, if you had made the decision to trade the strategies with the highest trading frequency or the highest profitable to drawdown ratios you would have made a big mistake as your probability of system failure during the next 12 years would have been very high. Seemingly contrary to what happens when you have small out-of-sample periods, when the intention is to have a long out-of-sample, trading frequency is not a determinant factor and in fact higher frequencies are detrimental to overall out-of-sample profitability. So focusing on this part of the spectrum is really not a good thing because neither higher frequencies nor better profit to drawdown statistics generated good results in the out of sample.
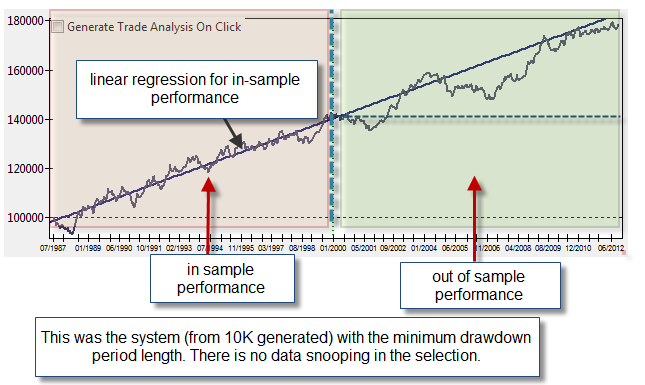
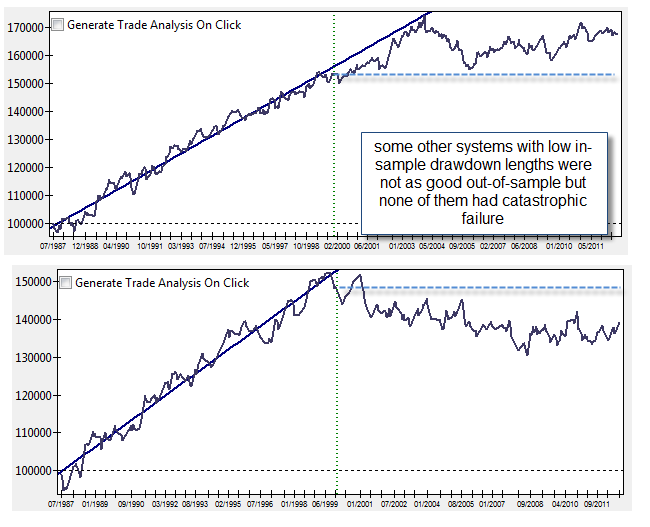
What works tremendously well (over 80% success rate) is actually a not so forward selection criteria. If you ignore everything else and only select systems that have very low maximum drawdown period length – for example less than 400 days – you end up with a bunch of systems that have a very high probability to succeed. These systems also have other things in common, such as relatively low trading frequencies (10-20 trades/year) and high stabilities (they are very linear in nature within the in-sample phase). Surprisingly if you had simply generated 10K systems and selected those with the lowest maximum drawdown period lengths you would have had a good chance of coming profitable in the next 12 years of out of sample testing. Statistics would have only been equal or better than in-sample on a limited number of cases (probably less than 10%) but in all cases you would be above your statistical worst case scenario and – in +80% of cases – you would be above a neutral balance change. Interestingly the worst cases here are not the highest frequency traders so although higher trading frequency does not lead to predictions of good long term out-of-sample performance, a high trading frequency on its own is also not a good criterion for discarding strategies. However if you attempt to restrict your maximum drawdown length search only to strategies that trade more frequently, you will get a much worse overall result.
As you can see, in the past we had a simple criteria related with the maximum drawdown period length that was more than enough to select a good trading strategy that would maintain its performance (or at least preserve our capital) for at least the next decade. The reason why this variable has such a strong predictive power can perhaps be related with the fact that it implicitly optimizes several other variables that are also correlated with system robustness. For example a short maximum drawdown length implies that the system has been able to tackle a significant portion of previous market conditions, hinting at a more stable system that is more linear and less prone to fall into losing territory. If a system has a maximum drawdown length of 100 days during a 10 year period it implies that it could handle a wider variety of market conditions in a positive manner than a system that had a maximum drawdown length of 200 days.
–
–
Another main reason why I believe this criterion works so well is because it is not related to performance. Whenever you try to optimize a strategy based on a measure of profitability (such as the Sharpe ratio or the AAR to maximum drawdown ratio) you are never able to achieve a positive long term out-of-sample with a good statistical edge (at least under my testing conditions). The market seems to punish those who attempt to follow the track of the best performing strategies (from a return perspective) while a reward is given to those who focus on the stability of returns. This makes sense as highly profitable in-sample strategies can happen due to many reasons, for example due to excessive profitability during a very reduced percentage of market conditions – while a very stable system loses in-sample profitability at the expense of a higher stability of returns. Fd has also suggested the use of the kurtosis and skewness of returns as predictive variables for out-of-sample performance and we will also see in future posts that these variables can also play an important role. I believe that the predictive power of these variables is also related to the fact that they are not related to performance but to the stability of the trading strategy.
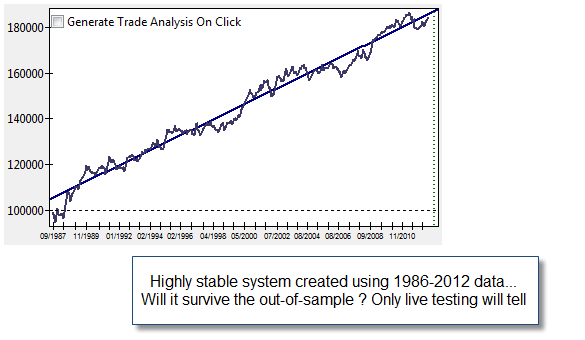
In essence the above research gives some hints into what might work when designing systems for long term profitable out-of-sample performance. Optimizing systems to give the highest return or lowest drawdown levels hasn’t worked in the past but using non-profit related variables that relate to system stability has yielded the best results. Choosing systems that have performed the most evenly across a large set of market conditions seems to be a key factor in the building of strategies that are bound to last for long periods of time. It is also interesting to note that these results hold when expanding the in-sample period, something interesting that supports the use of all in-sample data to build long-term profitable systems. Right now it seems to me that using 1986-2012 data to look for strategies that have extremely high stability would be a very good way to build strategies with a low probability for failure and – even if they fail – with the possibility of detecting failure in a very fast manner. Kayyerkan Trading a portfolio of the top performers – from a stability perspective – seems to be the best idea.
–
–
If you would like to learn more Kantu and how you too can build your own price action based trading strategies please consider joining Asirikuy.com, a website filled with educational videos, trading systems, development and a sound, honest and transparent approach towards automated trading in general . I hope you enjoyed this article ! :o)


Hi Daniel,
Cannot believe I/we did not think about this previously. So simple but makes a lot of sense. And as you said it will be quite easy to detect if the out of sample performance is not according to in-sample performance, which is a huge benefit! Congratulations on the new finding, really enjoying these posts as of lately…
very good article Daniel
I had also noted that maximizing total_profit / maximum_drawdown in data “in sample”, the “forward test” of those settings does not get results comparable to optimizations.
Instead, choosing settings optimized with low drawdown, the performance out of sample are never too bad
Hi Daniel,
Great findings! Have you got an opportunity to check this on our regular systems?
Caner
Hi Daniel,
Great job on Kantu and this entire series of articles – thank you!
While this may have been addressed in the past, how can we be certain that the DEM is a good proxy to the EUR for years before 2002 and actually use it for so many (17 years) of in-sample testing and strategy creation?
While Germany is and was the biggest economy in the Eurozone, but what would happen if had used the FRF instead in your analysis? Wouldn’t it be best if we used something like XEU (with the basket weights shown in http://en.wikipedia.org/wiki/European_Currency_Unit) to better approximate the Euro’s behavior before 1999?
Hi Christos,
Thank you for your post :o) Certainly the DEM/USD represented a large majority of currency trade between the US and European countries from the monetary union (>80% if I remember correctly) so it is very safe to assume that the DEM/USD was the best proxy for the EUR/USD. Certainly it would be interested to see the effects of using other less liquid European pairs for this analysis but sadly I do not have the data to do so. Thanks again for posting Christos, I am glad to read you’re enjoying the articles,
Best Regards,
Daniel
I see Daniel. Thanks very much for your reply and explanation!