One of the main problems of doing systematic data-mining to find trading strategies is that the amount of data-mining bias (the maximum profitability that a strategy over the same amount of random data could achieve) becomes very high as the amount of data drops for a given system logic space. This means that for a given set of system search characteristics (number of rules, number of variables, number of shifts, etc) the search becomes much harder as the amount of data becomes smaller. The consequence of this is that finding a system over – for example – 13 years of daily data might become very difficult because the level of profitability required to go beyond the determined data-mining bias is simply way too high. Today I am going to discuss why this happens and what strategies we can use in order to reduce the data-mining bias to allow for confident system generation even when the amount of bars used is not very big.
–
–
To learn how to reduce the data-mining bias we must first understand what created this bias and how it decreases. The data-mining bias comes from the ability of the generated rules to curve-fit the random data in a way that generates results that are profitable simply due to a spurious correlation. This implies that the data-mining bias is strictly related with the size of the logic space used to search for strategies, obviously your ability to curve-fit random data depends fundamentally on how much freedom your strategy has to adapt to the random data. If you are trying to produce a price action based system based on 10 OHLC rules with 10 shifts, you have a huge logic space that the generation process can use to adapt to the random data. The smaller the random data set, the easier this will be.
From the above it is clear that you have mainly two strategies that you can use to reduce your data-mining bias, the first is to increase your amount of data (like going to a lower time frame — which also increases computational costs) or you can also reduce the complexity of the systems you’re searching for. Reducing complexity is the most rational solution to the problem, since it reduces the logic space at the same time as it reduces the data-mining bias significantly. While it may be virtually impossible to go over the data-mining bias for a system generation process that expects a very complex strategy (many rules, many inputs) it is quite easy to go over the data-mining bias for a strategy that expects only a small number of rules and inputs. The increase of the data-mining bias with system complexity is exponential while the decrease of data-mining bias with data length is approximately linear, meaning that reducing complexity is always a better strategy to reduce bias vs increasing the amount of data used.
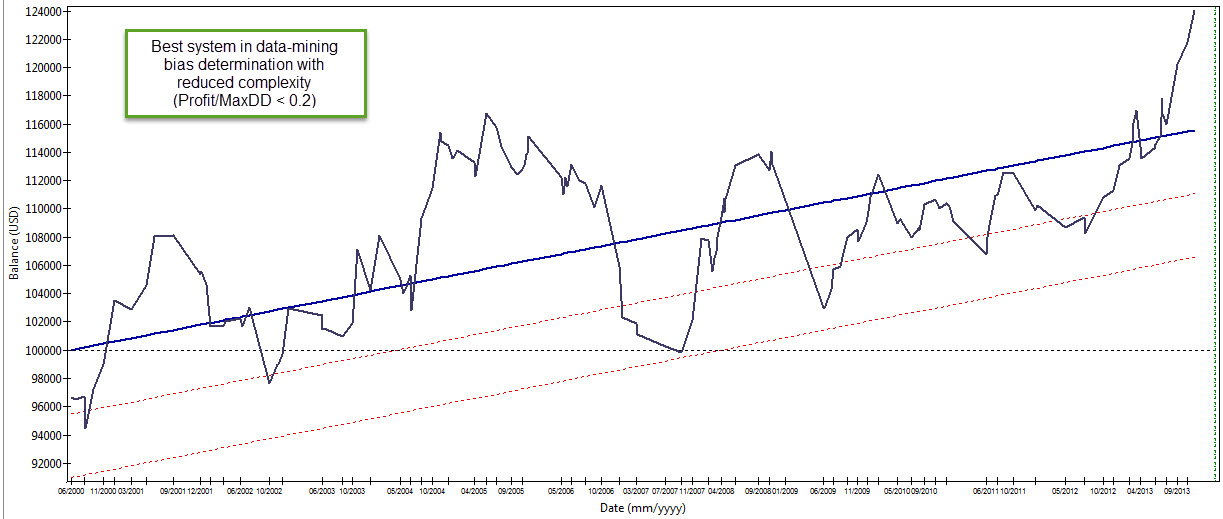
But how much should you reduce complexity? The data-mining bias exercise we did before using kantu (see here and here) gives a relatively small data-mining bias of 0.2-0.4 Profit/MaxDrawdown over a 25 year period using random daily data. However when we move this same simulation to a 13 year period the data-mining bias is increased to a much higher 1.2-1.5 value. This means that finding daily systems for the 13 year period will be much more complicated since the reduced amount of data now demands a much higher profitability from the generated system which is much harder to find (which probably does not exist within the demanded complexity). If we only have 13 years of data we need to reduce the complexity of our expected strategies such that the bias will be much smaller if we wish to use the daily timeframe.
In the above case reducing the maximum rules to 2 (instead of 3) and reducing the maximum SL to 2 (instead of 3) reduces the amount of bias very significantly as the strategy is now unable to fit random data nearly as effectively as before. Since the reduction in bias is exponentially proportional to complexity, we go from a data-mining bias above 1 for the 13 year period to a value which is now inferior to 0.2. This means that we can now easily find systems that are meaningfully profitable within the logic space (represent a historically real inefficiency not coming from spurious correlations) provided that they fit a much reduced level of complexity. The parameter space is now much smaller (about only 350K systems) meaning that it is also easier to go through the whole logic space to find the system we desire. We have reduced data-mining bias and computational cost within a single system complexity reduction step.
–
–
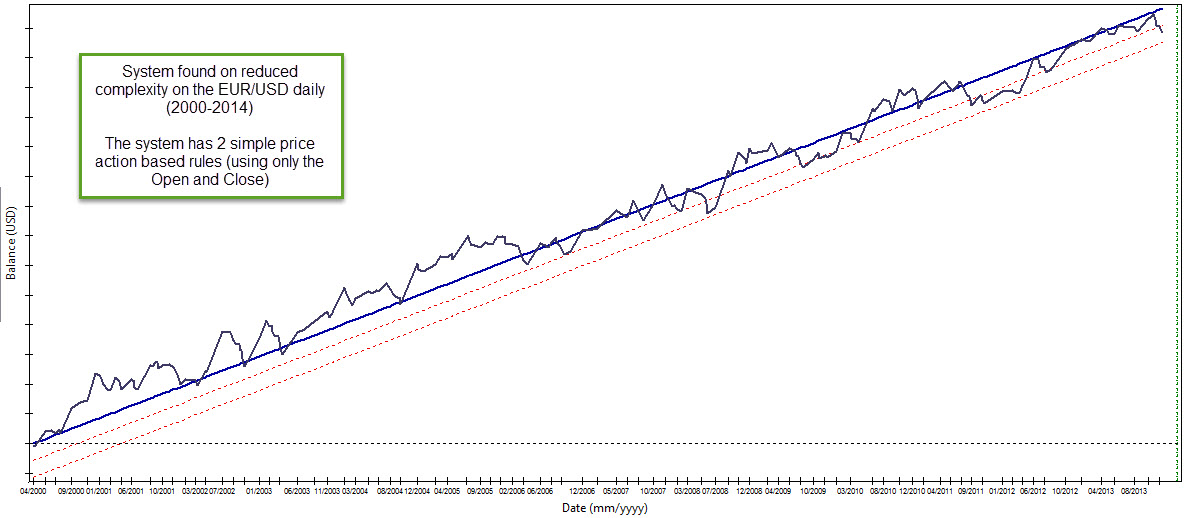
The above makes intuitive sense because a strategy with 2 rules and much less freedom in the SL would seem much less “curve fitted” that a strategy that has more rules. Whenever your amount of data is smaller you need to find simpler systems in order for your findings to be meaningful. Reduce your data-mining bias by reducing the complexity you’re searching for. This means that in some cases you may be unable to find systems – if such meaningful simpler relationships do not exist – meaning that you need a higher complexity and therefore more data, in order to find something that works for the instrument you’re exploring. In the example above using EUR/USD data it was easy to find many systems that were both highly linear and profitable above data-mining bias when using the reduced complexity.
Hopefully after reading this article you will be able to reduce the data-mining bias in your experiments where the amount of data does not allow for a large degree of mining complexity. If you would like to learn more about data-mining bias and how you to can generate systems through data-mining please consider joining Asirikuy.com, a website filled with educational videos, trading systems, development and a sound, honest and transparent approach towards automated trading in general . I hope you enjoyed this article ! :o)


Daniel, I’ve always like the idea of testing systems on random data as a way to approximately determine the amount of data mining bias. Your statement above confuses me though:
“In the above case reducing the maximum rules to 2 (instead of 3) and reducing the maximum SL to 2 (instead of 3) reduces the amount of bias very significantly as the strategy is now unable to fit random data nearly as effectively as before.”
If you do this after you’ve already seen the results of maximum SL = 3, it doesn’t change the amount of DMB. It is just selectively removing the results you didn’t like. This is akin to ensuring virgin OOS data. Once used, the data must then be considered IS.
Also, I’m aware that Jaffray Woodriff uses a method similar to this random data approach. But I am unaware of any peer reviewed research on this topic. Have you run any of the generally accepted methods to compensate for DMB (either White’s Reality Check or MCP)?
Hi Dave,
Thanks for posting :o) I’m not removing the SL=3 results because “I didn’t like them” but I am simply reducing search complexity in order to reduce data-mining bias. I have no idea if I am going to obtain better or worse systems when applying this to an actual real data series, I am only testing if this is going to lead to more or less data-mining bias using random data.
Bear in mind that I am aware that I don’t have any out-of-sample (everything is in-sample data), I am merely concerned with reducing data-mining bias over random data by reducing search complexity, in this way when I actually perform a search over some real time-series I will be able to more easily say if a historical inefficiency is real or caused by bias. Note that this does not mean that inefficiencies will be easier or harder to find on real data (since I am searching for simpler logic, none may exist — all of them may be more complex) but this merely constitutes a better first approach (less data-mining bias). I hope this better explains my point :o)
Best Regards,
Daniel
Reducing DMB by reducing complexity is NOT equivalent to rejecting the null hypothesis. I think you are going in circles. As the first poster said, you cannot reduce DMB by changing the rules that already generated DMB, because this is now data dredging. If it was this easy one would permute the rules with no replacement to get the combination that produces the least DMB. Actually, what you get by this is like a best case in an MC simulation but because the future is unknown this may be the worse case in the future. I think the problem is that everything you do now, including this analysis, is biased based on what you have done before. if you have not found a superb system already, due to data dredging the probability of finding one now is extremely low because all of your actions depend on previous actions, like the very post. I am not trying to discourage you Daniel, I am trying to save you time. The problem is not reducing rules and this is what you do not understand. The problem is that your best rules are not good enough. These best rules performance cannot compensate for the DMB but even if they could they could still fail so you are back where you started.
Hi Bob,
I don’t think I understand very well what you’re saying. If I decide a given data-mining technique, then determine DMB using random data, then generate systems on a given symbol above DMB, how is this wrong? The systems obtained are above DMB for the data-mining complexity selected or am I wrong? Obviously if you reduce complexity you reduce DMB on random data, how is this data dredging? As I see it, choosing a technique with less DMB does not mean that you will be more likely to find systems on real data, just that the DMB is lower since you have much less freedom in the logic space. Let me know what you think,
Best Regards,
Daniel
Hi Daniel,
“Obviously if you reduce complexity you reduce DMB on random data, how is this data dredging?”
It is as soon as you use the system on actual data and you determine it is profitable because you have used the same data many times before and you have tried to develop system many times before so your continuous effort amounts to data dredging. This means that systems with low DMB but unprofitable in the past may be profitable in the future. Do you see the problem? Can you go ahead and use an unprofitable system in the past for actual trading?
Maybe one way to deal with this: find a market that you never worked with. Then generate a system using data-mining on 100,000 random series. Get a distribution of MAR or some other statistic. Then generate a system on the new market you never seen before using the same-data mining technique. What is the probability the system statistic could be obtained by chance? This is to start you with but it gets more complicated down the road. And do not forget how recommended this approach: Some Bob…
I don’t see how this would be the case. I determine the DMB of a data-mining technique on random data, then I use this same technique on real data and I find a given system that is above DMB and also matches my criteria for system linearity. I will never trade anything unprofitable (I don’t see how this leads to something unprofitable becoming profitable?). I also don’t see how this changes if I have or haven’t used the data before. If you aimed for low DMB on random data and you applied the data mining technique on data I have seen (but you haven’t) the results would be the same.
I am never using information from the “real data” (either coming explicitly or from my previous experience) I am simply aiming for low DMB on random data (I still fail to see how this can be a mistake). Perhaps I am missing something fundamental? Let me know
Hi Daniel, Yes, you seem to be missing some essential insight, with all respect for your abilities and devotion to the subject.
A. Practical: How low of a DMB on random data is enough? The only way to find out is to run a significance test. You have not done that. You do not know how significant is the difference. Maybe the difference can be attributed to chance.
B. Basic: No matter what method you use, if you try hard and long enough you may come up with something that is the outcome of chance. This is why most trading system developers fail. Even if you find low DMB on random data, this may be the outcome of trying many times. There is another type of DMB which related to the continuing effort of trying to find a system. Till now you have tried to deal, unsuccessfully in my opinion, with DMB of a specific process of finding a system. But there is a worse DMB which related to the whole history of trying to find a system and the fact that the outcome may be due to chance alone, something you have not even considered or measured.
Hi Daniel,
you are approaching the strategy selection problem with a Occams Razor approach. Bob and Dave are right in saying that this technique will not necessarily lead to superior results (measured in return or survivability), it just depends which model comes more close to reality. If you want to find a method for strategy selection you have to do all your tests completely on unseen data. The equation “simple rules = robustness” is not always true. Within Asirikuy we have made already the experience that a very simple system (Teyacanani) failed while a more complex one (GGATR) did not.
Kind regards
Fd
Hi Fd,
Thanks for posting :o) Bear in mind that I am never implying that lower complexity leads to more robust results or a higher chance of success. I am simply saying that data-mining techniques that aim for lower complexity have less DMB (as confirmed on random data). This does not say anything about future performance or robustness. Thanks again for posting!
Best Regards,
Daniel
Daniel is correct in that the lower the complexity the less the DMB. But he misses the point that DMB increases when lower complexity is used repeatedly because of reuse of data and knowledge about what worked in the past and what did not.
Actually, Daniel, the information that lower complexity reduces DMB if reused many times increases your DMB. You are then back to point 0. You must find a way to develop a system that
A, Uses unseen data by you
B. It is not improved from knowledge of the past.
C. Its performance is significant with p-value < 0.01
Isn't you Kantu system base don a genetic engine? If it is, then at every evolutionary step DMB is increased because knowledge of the previous evolutionary step was used. At the end it don't matter if the rules are simple, because DMB is large due to reuse of past. While in actual Biology this is a useful process because it improves genes via natural selection, in trading system development it is a – please allow me to say – stupid process because we want actually to go back, not forward in evolution.
How long have you developing trading system? Frankly speaking and I think by being frank it is always good for people although their reaction may not be good, the problem is that with experience also increases DMB. This is why it is quite unlikely to see older trading system developer suddenly hitting a home run. If one has been doing this more than 5 years and has not a robust, highly profitable system, it maybe more profitable to quit right there because the probability of finding one is near zero if not exactly 0. But most continue because of hoping for a miracle. In the whole miracle literature, there are no instances of someone missing a leg or an arm to see it suddenly being replaces because of faith alone. Only miracles related to coming back to life from death or to getting back senses. But that is not enough to hit the jack pot. From drawdown of 95% going back to 0% is not enough. The miracle is to go from 0 profits to $1M or $10M of profits. If all this work you are doing is not for getting a miracle ,then it is more profitable for someone with your unique abilities and intelligence to do something else. If you work on Big Data for example, you can develop a software a hit a home run in 2 years. Let the rest search for the miracle system. With all respect of course….
Hi Bob,
Thanks for your comment. Kantu does not use genetics, it perform searches of the entire system space sequentially, genetics are available as an option, but I do not use this for system searches. Also bear in mind that I have been trading systems that have been profitable for the past 3 years, so I already have profitable systems. My quest is more related with finding new systems to be even more profitable, increase my understanding of the market and diversify my investments.
Regarding DMB, note that I have done the exercise you suggested on an unseen market (oil futures, which I have never traded). My conclusions remain unchanged and my results remain the same as displayed on this article. I therefore believe that my process is sound. Systems generated within this method – determine DMB on random data and then mine systems above DMB – have already showed some months of profitable live trading within linear regression boundaries, so although still early I am confident about the methodology. Thanks again for commenting,
Best Regards,
Daniel
” Systems generated within this method – determine DMB on random data and then mine systems above DMB – ”
But how significant is the difference. Have you run any significance tests? Could the difference be by chance or by the fact that you are specifically looking for a difference?
I think you still do not get my point: if you consider 10 markets and you select the market for which you get a low DMB, this is in itself DMB because you select the best performer. You have to account for all the other markets and all systems that you did not select. Why in the other markets there was a high DMB?
This is the fourth time II think I am rephrasing the problem, trying to see if you will respond. But your answers has been the same as above.
“…have already showed some months of profitable live trading within linear regression boundaries, so although still early I am confident about the methodology.”
I am confident to because I suggested it to you but it was part of the complete methodology. You are missing significance tests and correction for methodological DMB.
Obviously this has to be done. I search systems when I mine so that the confidence I have that they are above DMB is at least 99%.
I don’t understand this. Suppose I have 10 instruments where I want to generate strategies, I generate random data and search for the DMB for each one using a low complexity method. In all cases the DMB is very low because the complexity is very low (there is no “select the market with the lowest DMB”, I search on all of them regardless of their DMB relative to each other), I then look inside these markets for trading strategies above DMB, I trade all the best strategies from all the markets I’ve looked into. I do not see how the above could be wrong. I am not applying any selection bias, I am not selecting the “market with the lowest DMB” in anyway. There is no dependence on my “past experience”, etc. I am just looking at the DMB on random data for all markets and then choosing whichever is above them.
I have changed to instruments in the futures market that I have never seen and my conclusions are the same… In any case, the approach seems to be working properly, strategies are working and the results are in-line with what I desire. Thanks however for trying to get your message across and sorry if I didn’t get it :o)
Best Regards,
Daniel