Back in December 2010 (see the original post here). I shared a free strategy portfolio consisting of three separate strategies for the EUR/USD. This strategy portfolio – which I called Atinalla FE – traded three different trading strategies using the Bollinger Bands (BB), Commodity Channel Index (CCI) and Relative Strength Index (RSI) indicators. I followed the strategies through live trading for a few years (on two separate accounts for those who remember) but after deciding to move completely outside of MT4 in 2013/2014 and closing all my MT4 accounts I stopped following these strategies (as they are too poor compared to my current standards for live trading). On today’s post I am going to take a look at the back-tests for these strategies (their F4 framework versions) to see how they have fared during the past few years. We are going to see if their initial expectations still hold and we are also going to talk a little bit more about why I no longer use them for live trading.
–

–
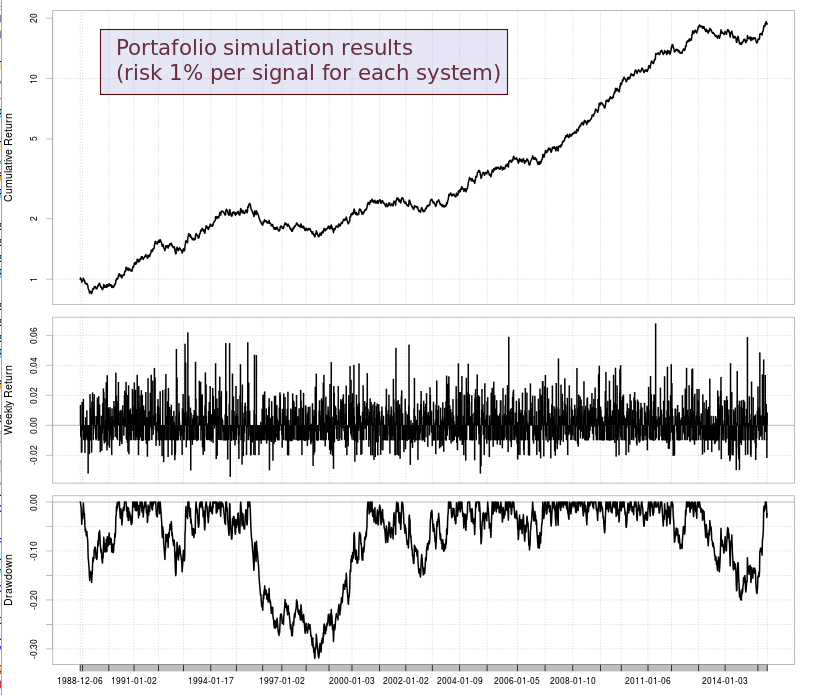
I want to take a bit more about the systems first. The portfolio uses 3 strategies which are all mainly trend followers. The RSI system is a breakout system in which we enter trades in the direction of the trend following strong momentum as indicated by the RSI, the BB system enters trades when price closes above/below the upper/lower bollinger bands plus/minus a buffer (which is calculated as a percentage of the daily ATR) and the CCI strategy is also a breakout strategy that enters trades as price closes above/below a given CCI threshold. The strategies all have stoploss and takeprofit values, denominated as percentages of the ATR, and are programmed to risk a fixed percentage of equity on each trading signal. The systems follow a stop-and-reverse logic (long signals cause a close and reverse if a short is open and vice versa) and signals in the same direction trigger resets of the stoploss and takeprofit levels. The picture above shows you the 25 year back-testing results for the strategies.
It is worth noting that back in 2010 I only had access to 2004-2010 1M data, reason why the back-testing performance that we get now (using the 1986-2015 set) shows that returns are not smooth across the whole testing range. We have several periods in the pre-2000 era (where we use DEM/USD as a proxy for EUR/USD) in which trading does not work very well. Additionally returns cannot be considered very stable at all – even in the 2004 to 2010 data – as the correlation coefficient for this period is not above 0.95 for any of the systems. Back when I built these systems I was not using stability as a criterion for evaluation as I used the MT4 backtester which does not include this type of statistics in its output (so my optimizations never accounted for stability of returns). Surprisingly the strategies do not collapse on all the data that was not included within the original design phase, a testament to the robustness behind some of the underlying principles (like following momentum).
–
–
You will also easily notice that the risk adjusted returns are not that great at all. The strategies mostly make a 1.5-3x increase in capital over a 25 year period with a 10-20% historical maximum drawdown. This speaks about their compounding efficiency which is quite low due to their limited trading frequency and poor trade expectancy. It is also evident where the design period is located, the graphs show the smoothest performance and least drawdown for all strategies during the 2004-2010 time range, giving us a quite decent example of curve-fitting bias (strategies failing to capture an overall general property of the market). The 6 period was long enough to capture some sense of generality but failed to provide a concrete base. The RSI system plot for example shows how the optimization during this period probability led to an exaggeration of expected performance. Combining the three in a portfolio increases risk adjusted returns significantly, although results are still too poor.
What is most interesting are the results after 2010, when the strategies were partially traded live. The BB and CCI strategies seem to have performed acceptably during this period – at least generated some return – while the RSI strategy went almost directly into a drawdown period. Drawing a line for the RSI system during the 1988-2003 period – which is the longest most stable performance – we can see that the strategy is probably coming back from a period where performance was much stronger than would be expected for the exploited inefficiency. It wouldn’t be surprising if the strategy lost significantly more before starting to profit stably again. It is however clear that 6 years was a too short period for the creation of strategies for a single pair – something that I have confirmed repeatedly – and more data is needed to obtain a more general picture for a given trading system. The portfolio shows an indeed significant positive return after more than 4 years (having survived a drawdown of almost 20%).
–
–
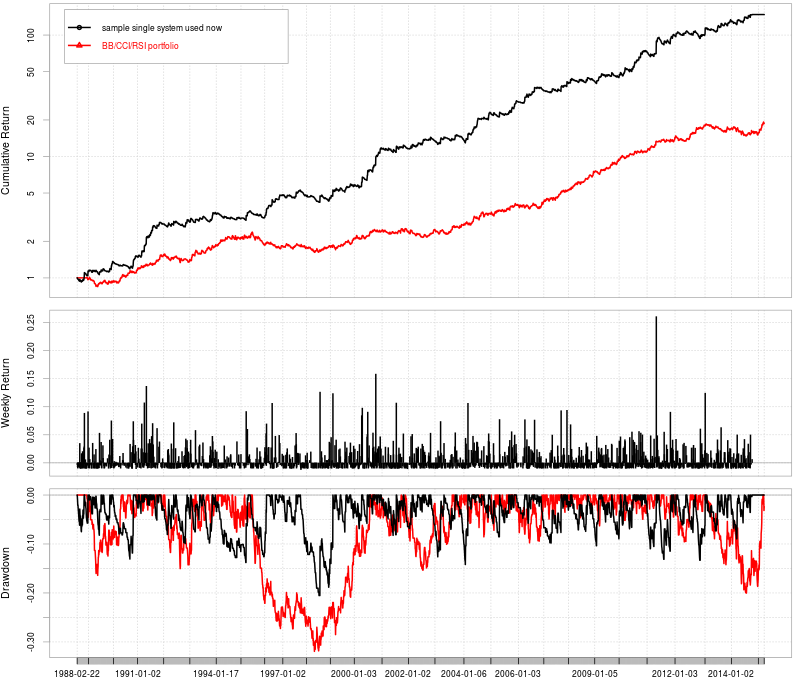
These strategies are now unacceptable to me from several perspectives, including risk adjusted returns, stability, standard deviation, compounding efficiency, etc. Right now I demand strategies to give highly stable performance during the entire 1988-2015 data, with a very strong correlation coefficient (on log(balance) vs time) and a much lower historical risk. The third image shows a comparison between this portfolio and one of the systems I use now (a system created one year ago), you can see that this old portfolio is very inferior (cumulative return axis is logarithmic!). However it is surprising that these old strategies were able to survive and actually profit, given the low quality that I now assign them according to what I have learned about strategy design and evaluation during the past 5 years. Of course, I suffered through that 20% drawdown in the 2011-2013 region on live accounts and periods like these sparked great ideas that led to the much stronger methodology we have today. If you would like to learn more about how I build trading strategies and how you too can create trading systems based on highly stable historical returns please consider joining Asirikuy.com, a website filled with educational videos, trading systems, development and a sound, honest and transparent approach towards automated trading.


Daniel,
Thanks for the great post.
What, in your opinion, is the most significant difference between the Atinalla system and your “new” trading systems?
Is the improvement in performance due to exploiting other inefficiencies in the currency pairs, or by exploiting the same inefficiencies in a different way (for instance, only trading the system under specific conditions/times). Or is the improvement due to hedging by using the trading logic to other currency pairs or by using systems of multiple strategies?
Glad to see an influx of new blog posts recently:-)
Kind regards,
Edward
Hi Edward,
Thanks for writing. I would say that the main differences are that the current strategies have much better ways to exit the market plus they exploit simpler price-action based inefficiencies. These Atinalla systems had very primitive trade management skills. We also now have much more powerful and systematic methods to search for trading strategies (while properly measuring data mining bias) so all this generates a much better trading strategy output. All these years of experience have given us the tools to radically improve our trading. Glad you like the new posts :o) Keep on commenting,
Best regards,
Daniel