When building systems using OpenKantu you will notice that it is rather easy to find strategies that generate high R² results on symbols like the EUR/USD and the USD/JPY while it is generally significantly hard to get positive results on symbols like the AUD/USD. I have done a lot of research about why this is the case – you can read more about that here – but finding systems on symbols where it has been traditionally difficult for me to find any has always been an interesting goal. Today I want to show you how you can actually use the OpenKantu software to find some highly historically stable strategies on the AUD/USD, we will discuss why this is the case and the potential problems that are present when this is done.
–
–
When you use OpenKantu to mine trading strategies on the 1D charts and you choose a simple stop-loss as the only way to control position closes what you have is that most systems found by OpenKantu behave somewhat like trend followers. This is due to the fact that the generated systems have their SL updated whenever a signal is generated in the same direction as an open trade – this is done to avoid trade chain dependency – and a trade is only closed either when the SL is touched or when a signal in the opposite direction is triggered. What happens is that the SL tends to behave like a “trailing stop” within the profitable systems that are generated and the systems end up benefiting from long term momentum, in the end you end up with systems that are in some senses trend followers.
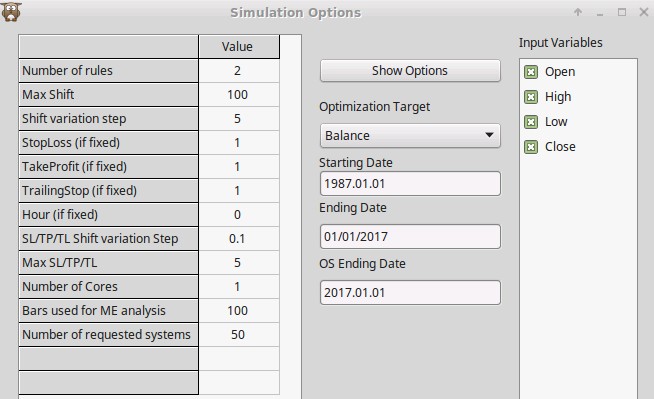
When you mine systems like this on the EUR/USD, USD/JPY, USD/CHF or GBP/USD you tend to find a large number of strategies but on other symbols, especially a symbol like the AUD/USD, the landscape is usually terribly barren. This is because on these first symbols there is an abundance of strong momentum through their history while in the AUD/USD there does not seem to be enough of this to generate strategies of this type at all. The solution to avoid generating this type of system and instead find some highly linear strategies is basically to simply enable the use of the take-profit and use a space where the max shift is restricted to be lower than 100.
–
–
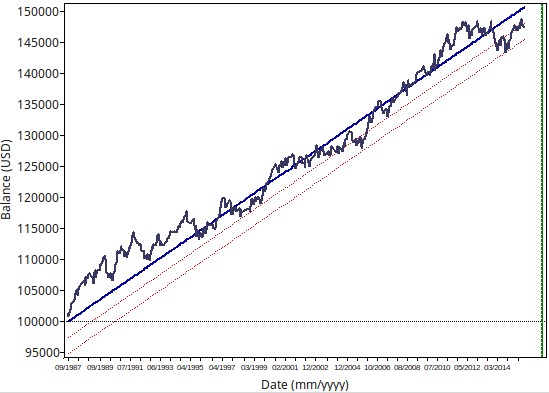
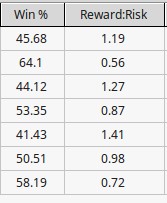
Doing the above allows you to find systems with R²>0.95 with a frequency of more than 10 trades per year using daily data from 1987 to 2016. The produced strategies are alike the strategy showed above where historical results are quite consistent through the entire period. Although as you can see in the options the SL and TP are allowed to vary between 0.5 and 5 in 0.1 steps we actually do not find very extreme SL to TP ratios but as a matter of fact – as showed below for a sample of mined systems – there are both SL>TP and TP<SL cases but most actually have R:R ratios between 0.8 and 1.3. There is only one extreme case where the R:R is 0.56 where the TP is 1.3 and the SL is 2.7 (the most extreme ratio is the samples I mined).
Of course the introduction of the TP implies the introduction of an additional degree of freedom which implies that the mining bias of the process has been increased. It is possible that all of the generated results are therefore the result of pure mining bias – rather than the presence of true historical inefficiencies – reason why it’s important to repeat the exact same mining process on data generated using bootstrapping with replacement to ensure that the mining bias of the process is low and that the systems generated have a low probability to come from random chance.
–
–
The above results also support some of my previous observations regarding reward to risk ratios and how establishing different reward to risk ratios forces the creation of trading systems that are very fundamentally different in nature (see here). Not only do the reward to risk ratio can affect the resulting data mining bias of the process – because the number of systems that can be found just by random chance chances – but it can also increase the number of systems that are in fact found on the real data. Not all pairs might be suited for all reward to risk ratios and finding systems on pairs where it has been traditionally harder might only be a matter of changing the system character we’re asking for. If you would like to learn more about trading systems and how you too can learn to design and trade your own strategies please consider joining Asirikuy.com, a website filled with educational videos, trading systems, development and a sound, honest and transparent approach towards automated trading.strategies.


