The number of statistical measurements available when you start looking into the back-testing of trading systems is simply overwhelming. There are a ton of different ways to approach the problem of system performance and there isn’t a single number that can tell you that a trading system is good or bad. This is mainly because different statistics measure different aspects of system performance and there is simply no single value that can encompass the problem since you simply cannot reduce a multi-dimensional problem into a single value without losing important information. Today I am going to talk about a simple three-category classification that can help you understand what different statistics are useful for and how they can all be put together to give a real picture of system performance.
–
–
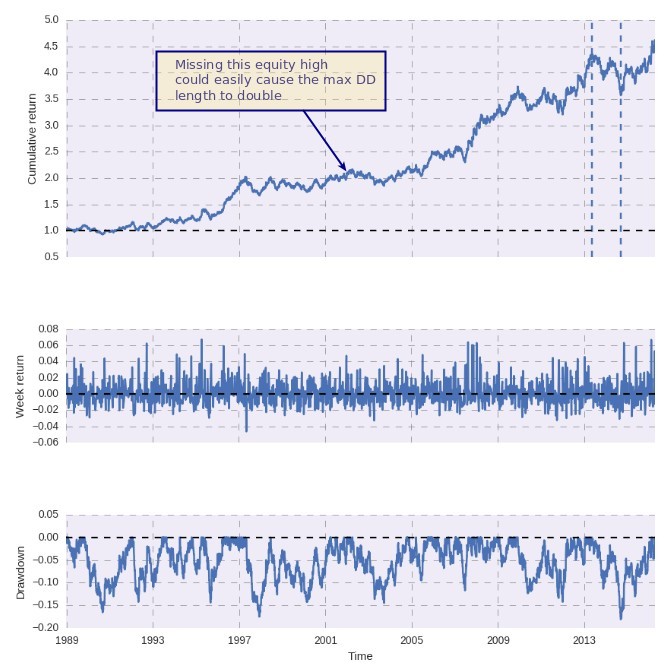
The first category of performance statistics is what I would like to call “extreme statistics”, these are the least useful and probably the most used. They rely on the extreme value of a back-testing property and can therefore change values dramatically with even small variations in back-testing performance. Two well known examples for this category are the maximum drawdown length and the maximum drawdown depth. These statistics are popular because they are perceived as risk limits – the worse you did historically – but in reality they are of little usefulness since simple differences in the randomness of results could increase them very significantly. This is why these statistics are all expected to be worse in the future, because the future will explore potential outcomes that back-tests never show, even if the distribution of returns of a strategy remain unaffected.
The second category is what I would call “per dollar statistics” and they have the intention to show how – on average – a dollar invested in the strategy would behave. They tell you nothing about how the strategy trades as a function of time, but merely what the expectation for a dollar invested in the strategy would be. Two typical examples of this category are the expectancy and the profit factor. The expectancy, calculated as (win rate)*(reward to risk) – (loss rate) aims to tell you how many dollars you are expected to make on average per every trade taken while the profit factor aims to tell you how many dollars you are expected to win for every dollar you put at risk. These statistics are very useful because they are very closely related with trading edges, larger edges inherently have better returns per dollar invested.
–
–
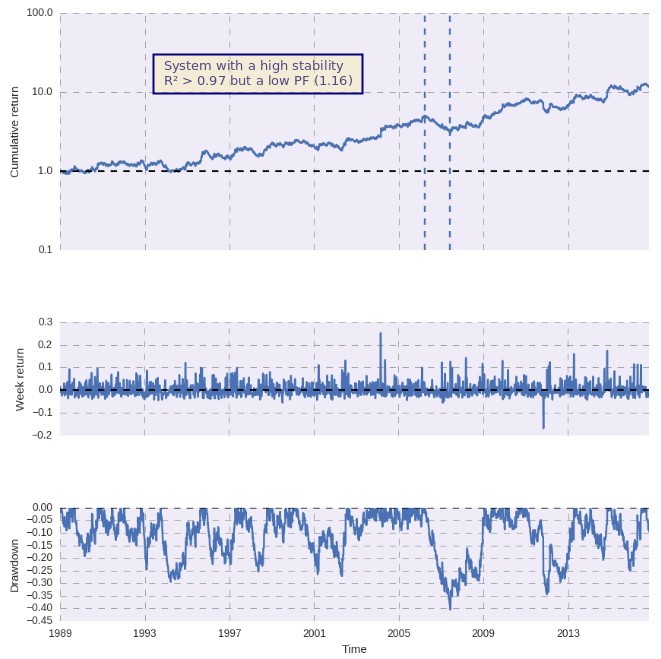
The third and final category is what I call “balance curve quality statistics” they aim to tell you how good your balance curve behaves as a function of time. These are the values you would look at to ensure that you have a “smooth ride”. Two examples of this category are the sharpe ratio and the pearson correlation coefficient. The Sharpe ratio tells you how your average return relates with the average standard deviation of returns while the pearson correlation coefficient tells you how closely your evolution of equity follows a straight line (which would be the ideal system progression). These statistics are very different from the two groups before as having a high balance curve quality does not necessarily mean that you have great “extreme” or “per dollar” statistics.
In the end getting a full vision of whether a trading system is good or not requires an evaluation of all of these statistics. Extreme statistics are very useful to make testing faster – because they never go to lower values a back-tests can be stopped if an extreme statistic crosses a given threshold – while “per dollar” and “balance curve quality” statistics can be used to assess whether a trading system that comes out of a simulation has both a strong enough edge and a stable enough progression in time to be considered useful.
–
–
Sadly back-testing statistics are of limited usefulness as well as they do not describe the future, but merely past behavior. Since back-tests are carried out with the benefit of hindsight they are prone to many statistical biases that can render systems – even those with excellent statistics – completely prone to forward failure. If you would like to learn more about system development and how you too can create or mine your own trading strategies please consider joining Asirikuy.com, a website filled with educational videos, trading systems, development and a sound, honest and transparent approach towards automated trading.strategies.


