There are many different opinions on how system construction should be carried out. Suggestions go from using only recent data and then regenerating or reoptimizing systems after a given period of time to performing system creation using all available data. On today’s post I am going to show evidence on why the later case is the one that makes the most sense and why failure probabilities and other problems are expected to be much higher with shorter amounts of data. I will also talk about why the idea of fixed regeneration or reoptimization does not make a lot of sense and why all this inevitably leads us to system creation methodologies where no historical out of sample tests are either necessary or even advisable.
–

–
The idea of using limited amounts of data and then repeating system creation procedures every given fixed amount of time seems to make a lot of intuitive sense. Methodologies that follow these lines make the assumption that recent historical data is the most relevant and that in order to avoid performance deterioration it is critical to maintain your trading system aligned to whatever market conditions have happened recently. The evidence that supports this assumption is scarce. I have showed in the past strong evidence that really old market conditions are relevant to predicting more recent market movements, a fact that completely obliterates the notion that past data is irrelevant. However people arguing for the “recent optimization” argument might expose that it is not that the past is irrelevant but that recent conditions can simply more accurately predict the immediate future.
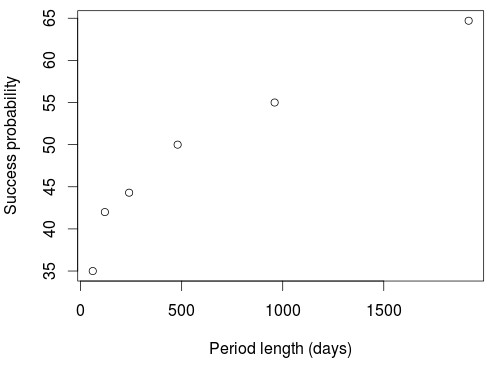
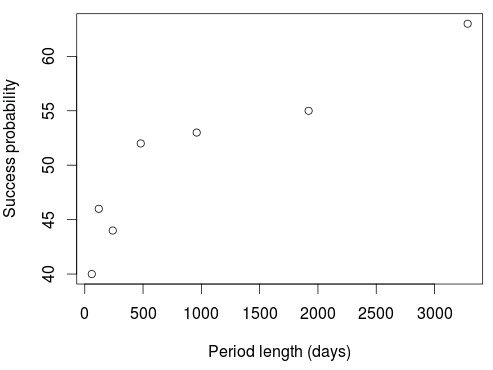
To test this we can test the probability of trading success across randomly chosen periods of different lengths if strategies are generated for one period and then tested on the one just following them. For this I tested a simple price action based generation methodology on the 1H charts such that the only prerequisites to be selected was for the system to be profitable during the design period, have more than 10 trades and to have a correlation coefficient (R²) higher than 0.90. The generation procedure was continued until at least 5000 systems had been generated across randomly chosen periods for each desired length. The generation and testing periods are exactly the same length, so if generation was done for 60 days then the testing period was the immediately following 60 day period to the initial generation time span. The tests used data from 1986 to 2016.
–

–
If we do this we obtain results as those shown on the two graphs above, which are equal across several different Forex symbols (the above are results on two different symbols). Trends remain the same with variations in the generation methodology – relative evolution of the success probability is exactly the same as a function of period length – although the absolute success probability values do change depending on the actual generation method (system building space, filters used, etc). These plots show us how the probability of a profitable outcome increases drastically as a function of the generation period length, such that success across short periods is very low while the number of expected profitable systems grows bigger and bigger as the sample size increases. This means that you have a historically better expectation to be profitable across a period equal in length to your design period if you use more data. Your probability to fail and over-fit is therefore strongly related with how much data you use, if you use more data you are much less likely to face this problem. This makes sense as more data means that your system can face more market conditions. For the above methodology extrapolating to a 30 year in sample would give us a success probability above 80% while for others it can be above 90%.
Given the above it then makes sense to use just as much data as possible for the design of trading strategies. This means that leaving any data out for any historical in sample Vs out of sample tests is a futile exercise because you’re removing market conditions that could benefit the design process. Such out of sample processes also fail to bring any real benefit since they end up being a part of a more complex curve fitting exercise since their results are generally used to redesign the trading strategies (see this previous post I wrote on the matter). Using as much data as possible provides the greatest probability that your systems will perform positively under real out of sample conditions since they will be prepared to face the largest amount of variability that can be inferred from the historical data.
–

–
Establishing a fixed period for regeneration is also unwarranted since there is no fundamental reason to re-engineering a strategy that is working as expected. Since the way in which market conditions change has no immutable pattern we should keep strategies trading for whatever period they perform in line with their historical distribution of returns. If the market happens to behave in a manner that a system can handle very well for 2 years then there is no reason to impose a regeneration every 2 months. Doing adequate monitoring of trading strategies to remove them from trading, especially without such removal necessarily implying significant losses is a way to do this (see this post). In this manner systems are removed when they stop working but they can take advantage of long profitable periods if they choose to happen.
If you would like to learn more about constructing a trading system methodology and establishing statistical based scenarios for the failure of trading strategies please consider joining Asirikuy.com, a website filled with educational videos, trading systems, development and a sound, honest and transparent approach towards automated trading.


Great post as usually and just the way I work as well and what my findings are. Systems created on recent market conditions failed a lot faster for me than systems created on ALL data. OOS makes no sense as we already know, since it becomes in-sample anyway since you will not trade a system that performs bad on OOS and hence keep on searching until you find one that does good on OOS as well, which means all data is IS in the end anyway, so you can us all data IS from the start already as it leads to the same results and actually faster.
Thanks for posting Geektrader :o) Yes, indeed, all evidence points to the fact that optimizing through the entire data is the best solution. Any type of slicing or dicing of the data seems to lead to sub-optimal results, at least on all the symbols and generation configurations I have tested as well. Thanks again for posting!