As a systematic trader interested in the automatic design and classification of algorithmic trading strategies I am always looking for better ways to classify and judge the quality of trading strategies. Along the past few months I have posted about some issues with general performance metrics, especially with metrics like the Sharpe ratio (like in this article), seeking to come up with measurements that are both better at comparing the quality of two distributions of returns and that eliminate some of the important and often wrong underlying assumptions of some traditional performance metrics. Today I want to talk about the Omega ratio, a performance measurement that is much more mathematically elegant than the Sharpe ratio and that allows us to compare the quality of two different systems regardless of the shape of their distribution of returns.
–

–
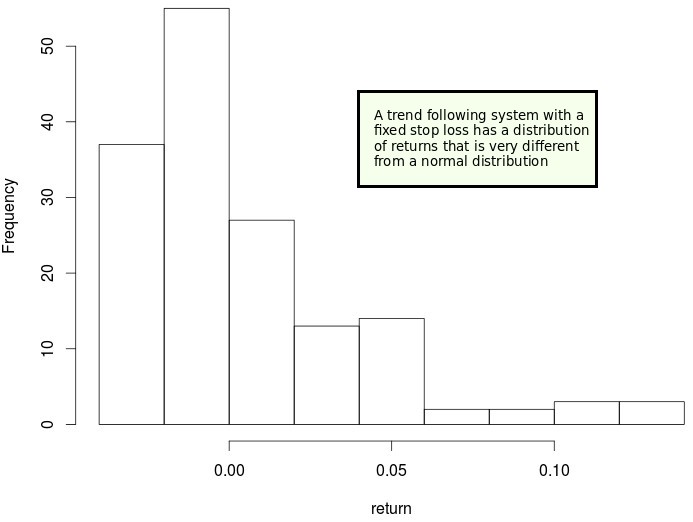
The main problem with performance metrics like the Sharpe ratio, the Sortino ratio or the Calmar ratio is that they make some assumptions and simplifications in order to give us a number. The Sharpe ratio for example assumes that all we want to know about a system is expressed by the average return and the standard deviation. This would be most likely true if we were trading something for which the distribution of returns was perfectly normal but it falls short whenever the distribution of returns for the strategy is more complex than that. For example a traditional trend following system with a single stop – as showed above – has a distribution of returns that is very different from a normal distribution. This is because we have many instances of trades hitting a small stop and then a few trades that more than make up for it by achieving much higher profits. However since losses can never be much bigger than the stop we don’t have any tail towards the short side.
Using the Sharpe ratio in the case above gives some information but it completely misses the point that the distribution of returns is not normal and therefore we could say that the above system is exactly the same as a normally distributed system that had exactly the same mean and standard deviation — which is objectively not the same thing. The Omega ratio attempts to fix the above by relying on the entire and particular distribution of returns of a system to judge system quality, without making any assumptions about how the distribution looks or what information within the distribution is important.
–

–
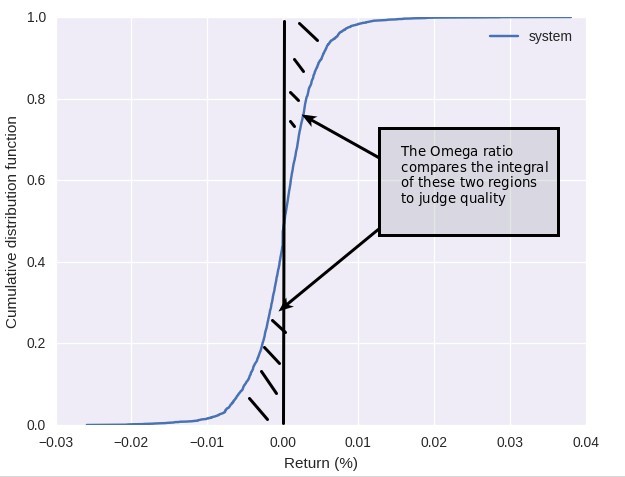
In the Omega ratio we use the cumulative distribution function (CDF) of the distribution of returns and then calculate two integrals around a return level that we consider our “minimum acceptable return”. In the image above I have chosen zero as this value. The integral to the left tells you the weight of the “losing part” of the trading strategy while the integral towards the right tells you the weight of the “winning part” of the trading strategy. By calculating the ratio between these two (right integral/left integral) you get an instant view of which part is more relevant and by how much. As you can see we use the CDF which is derived directly from the distribution to make the calculation so we make no simplifications regarding what is important or make any assumptions about normality.
Given that the distribution affects the shape of the CDF two systems with the same mean and standard deviation but different distribution shapes will inevitably give the same Sharpe ratio but different Omega ratios. Due to this fact we will be able to discriminate between two systems and tell which one of the two is most likely a better choice provided their distribution of returns are not identical. The Omega ratio is therefore a finer performance measurement because it can most likely better discriminate between two strategies that look very similar from the point of view of the Sharpe ratio analysis. The same happens when we consider other types of ratios where two strategies can give very similar results even if the distribution of returns are fundamentally different. The omega ratio is also not perfect and we’ll discuss its defects in a future post.
–

–
To make the calculation of the omega ratio much easier the Omega ratio has been added to the qqpat python library (>=1.524). You can calculate it using the function get_omega_ratio, it has also been added to the statistics summary function. A function to plot the CDF called plot_cdf(), which allows you to plot the CDF of all the files you load, has also been added. If you would like to learn more about trading system creation and how you too can learn to design and code trading strategies please consider joining Asirikuy.com, a website filled with educational videos, trading systems, development and a sound, honest and transparent approach towards automated trading.strategies.


