Yesterday I had a conversation with an Asirikuy member via email about the trading costs associated with trading our large portfolios and how this can represent a substantial erosion of profits with time. Although our simulations do accounts for trading costs – including much larger spreads than currently present within the market – it is true that spread costs in Forex trading can be a significant burden, especially when trading volumes become higher. Today I want to share with you a post about how we can select systems to diminish this problem, in order to create portfolios that have the best possible relationship between trading costs and expected performance. I will talk about the measurements that I have contemplated to solve this problem and how our large scale repository currently fares in this regard.
–
–
Currently a portfolio trading our +4K system repository at the risk necessary to achieve a CAGR of around 40% would incur in spread costs of around 1-2% per month. This means that you are paying 12-24% of your account equity each year as a consequence of the volume you’re trading. This is already accounted for in the simulations used to reach that target, but it means that results could be potentially much better and drawdowns potentially also much shorter if the amount of money spent on spreads could be reduced significantly. In the above case if there were no spreads the CAGR would be around 50-60% which would be much better in general terms. The problem of reducing trading costs in a portfolio therefore becomes significantly relevant to achieve better performance.
To trade more efficiently we need to find the systems that achieve the best possible return at the lowest possible frequency. If a system takes 10 trades to achieve a 20% CAGR at a 1% risk per trade and another system needs to take 20 trades to achieve the same result then the first system would be a better choice because it would pay half the spread costs than the first system. In this sense we can use the ratio of the CAGR to the average weekly trading frequency to create a ranking that shows us which systems are more and which systems are less efficient, which systems are expected to pay more in terms of spread costs with time.
–
–
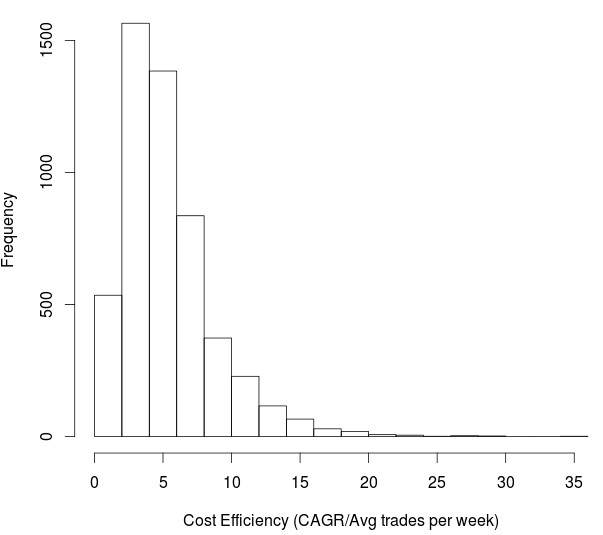
The distribution of systems in our repository according to this criterion is showed in the first image within this post. As you can see our systems are not homogeneously distributed and there are systems that are almost 1 order of magnitude more efficient than others. Most trading systems have a cost efficiency (CE) metric of around 5-6 (mean 5.36) while there are systems that can go as high as 35. There are trading strategies that can make 6 times the profit when compared with the average strategy with the same number of trades. It could therefore be possible to trade much more efficiently in terms of trading costs by selecting strategies with high CE metrics from the repository.
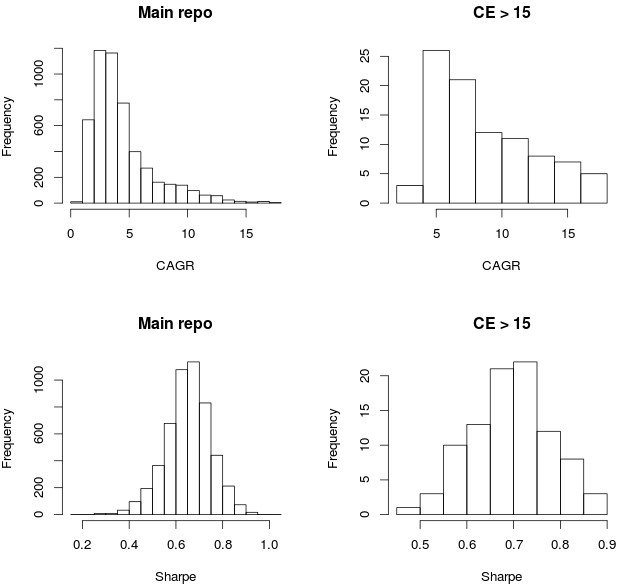
It is also interesting to ask whether this cost efficiency comes at any price relative to the other characteristics of the strategies. Perhaps much higher CE implies lower Sharpe. However looking at the distribution of Sharpe ratios for strategies with high CE values (CE>15) shows that the Sharpe ratio is actually higher on average (0.69 Vs 0.65) when compared with the general repository. This means that not only is the choice of high CE strategies better from a trading cost perspective but also better in terms of the Sharpe distribution of the selected strategies. This means that trading high CE may be a no-brainer since we gain a reduction in trading costs without an increase in volatility relative to the general repository.
–

–
From the above analysis it is clear that not all strategies are equal in terms of how much they are expected to cost. The above measurement could certainly be refined further – to weight by the average spread of the symbol where the strategy trades for example – but the above already shows that selecting a portfolio that minimizes trading costs may be a good way to increase performance under unknown conditions. Furthermore this can even be included within our mining to ensure that we do not accept strategies for which the expected CAGR Vs trading frequency ratio is too low. If you would like to learn about our trading systems and how you too can trade massive trading system portfolios please consider joining Asirikuy.com, a website filled with educational videos, trading systems, development and a sound, honest and transparent approach towards automated trading.strategies.


Excellent post! I suppose in this case selecting strategies of different trading frequencies could improve portfolio diversity.
“If a system takes 10 trades to achieve a 20% CAGR at a 1% risk per trade and another system needs to take 20 trades to achieve the same result then the first system would be a better choice because it would pay half the spread costs than the first system.”
Is it though? Second system paid more spread costs but still have the same CAGR. Could it mean that the second system is even more robust by principal? I’ll trade half of them each because they seem to reflect different market behaviour, thus add diversity.
Relation between CE and Sharpe is definitely interesting. Nice knowledge dump.