The Relative Strength Index (RSI) is one of the indicators I like the most because of its ability to condense significant amounts of important information into a single measurement. Because of this I wanted to see whether I could use a group of RSI measurements in order to device an optimal policy for trading the Foreign exchange on the daily timeframe. Today I want to talk about some of the results I obtained and why these point to the fact that successful simple systems can be created using reinforcement learning provided that the right information is used for policy generation. You will see how I could in fact generate an optimal policy using only RSI measurements across a significant number of Forex pairs.
–

–
The idea of reinforcement learning is to treat the market as if it was a game (you can read more about this here). We define a set of market states using some set of variables to describe the market and we then train an algorithm using Q-learning to derive an optimal policy for those market states. For this experiment I decided to use RSI oscillators of different periods in order to create a Q-value table that I could use for reinforcement learning. Using daily data from 1986 to 2010 to generate the optimal policy and then data from 2010 to 2017 to perform a pseudo out-of-sample test to see whether the algorithm was curve-fitted or not. Of course tests of the entire training/testing process over random data are also needed to establish data-mining bias. Note that these reinforcement learning based systems contain absolutely no take profit, stop loss or other exit mechanisms, the reinforcement learning approach merely decides at the start of every day whether it’s optimal to be long, short or out of the market according to its policy and trades accordingly.
The above image (EUR/USD backtest) shows you the first attempt I made using 256 different possible market states. With this amount of freedom the optimal policy for the training period achieves outstanding results in 1986-2010 but utterly fails when confronted with the pseudo out-of-sample conditions it didn’t see during the training phase. In essence 256 market states are too many and what we achieve during the training period is a curve-fitting to the data using the excess degrees of freedom within the Q-table that provide no additional useful information.
–


–
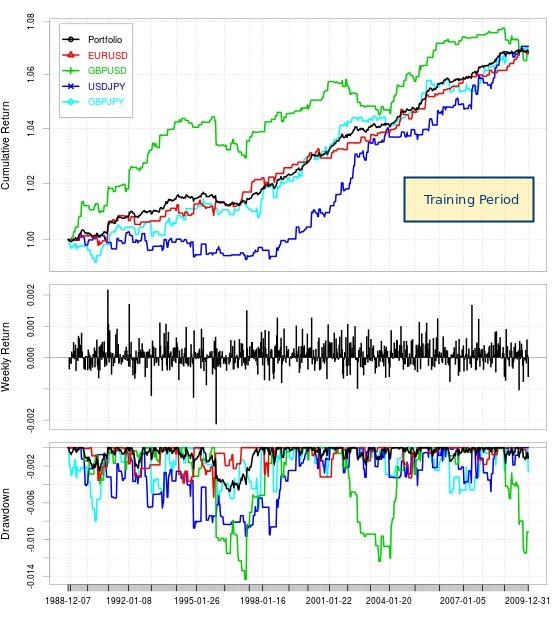
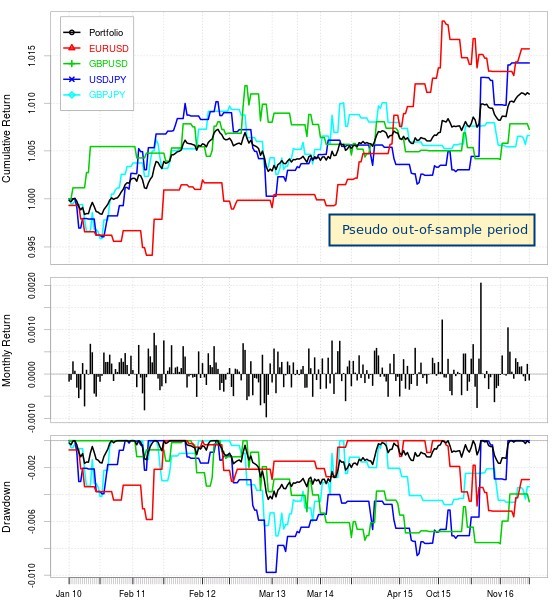
To alleviate this problem I moved to a Q-table with only 64 different market states, which were achieved using 6 different RSI oscillators. The above graphs show you the in-sample and pseudo out-of-sample results of using this algorithm over 5 different pairs including the result of a trading portfolio using all pairs. Results are much more successful with all pairs achieving profitable results in the pseudo out-of-sample. It is however worth mentioning that many of them do become much flatter in their pseudo out-of-sample compared with their in-sample period, while others – most notably the EUR/USD – basically continue the same trend they followed during their in-sample training period.
For the overall portfolio there is an important deterioration from the training period – which is expected – as the annualized Sharpe ratio decays nearly 50% with a value of 3.49 in the in-sample period falling to 1.90 within the pseudo out-of-sample period. It is almost certain that this would fall further within a real out-of-sample period, with a reasonable Sharpe to be expected possibly between 0.5 and 1.0, as the full effects of data-mining bias, curve-fitting bias and alpha decay become apparent in live trading.
–

–
With all this said it is quite surprising that the exact same market descriptors can generate somewhat successful policies across 4 different currency pairs on their daily timeframe. Even more so considering how simple these descriptors are. That said the policies do cause important restrictions in the decisions of the algorithms with the overall portfolio taking around 20 trades per year. It is also worth pointing out that this type of reinforcement learning trading system design is not trivially translated to things like GPU mining, however this might not be necessary as it is really easy to manually add and test these complex inputs as all the policy optimization is completely automated by the Q-learning algorithms. It might not be hard to generate a portfolio of a few dozen systems deriving optimal policies from similar descriptors.
Reinforcement learning approaches seem to benefit greatly from information condensation as their success is predicated on maintaining their degrees of freedom as small as possible in order to have a Q-table that contains the largest amount of real market information, leading to the smallest possible alpha decay due to curve-fitting and data-mining bias. I will continue exploring this type of approach and will share a few further posts about this with you within the following weeks. If you would like to learn more about reinforcement learning and how you to can trade systems based on this approach please consider joining Asirikuy.com, a website filled with educational videos, trading systems, development and a sound, honest and transparent approach towards automated trading.strategies.


