Through our cloud based data-mining efforts at Asirikuy we have been able to build a significantly large portfolio of systems trading on the EUR/USD, USD/JPY and EUR/JPY but so far we have not been able to generate systems showing real historical inefficiencies on the GBP/USD. On today’s post I am going to be talking about our experiments on the GBP/USD, what we have found, why we haven’t been able to generate any systems on this symbol and what steps might lead to successful system generation for this pair going forward.
–
–
At first it is probably useful to summarize how we find systems at Asirikuy (I am going to avoid giving too much detail to keep things brief here, my apologies to those of you who are fans of the hardcore statistics). First we decide upon a logic space to explore using data-mining (a set of price action rules to explore, usually billions of them) then we search for systems on the historical data (we use 25+ years) for a given symbol using these rules and we then proceed to perform the exact same exercise on random data sets built from bootstrapping with replacement of the return series of the original historical data. We do system generation runs on random data sets until the distribution of profit:drawdown for the systems generated on random data converges. In this way we measure data-mining bias and are able to say within a given confidence interval whether the systems on the real data do not come from random chance.
This may already show you why it is not that easy to find systems to add to our trading portfolios. We not only need to find a system that fits some desired historical performance metrics (correlation coefficient, standard deviation, profit factor, maximum drawdown length, etc) but we must be able to have enough confidence that what we have found is not purely the result of random chance (we usually seek to be above 99% confidence that the system does not come from chance). The issue with the GBP/USD is not that we aren’t able to find systems that fit our desired performance metric, but the issue is that the probability to find systems from random chance is usually too high as well.
–
–
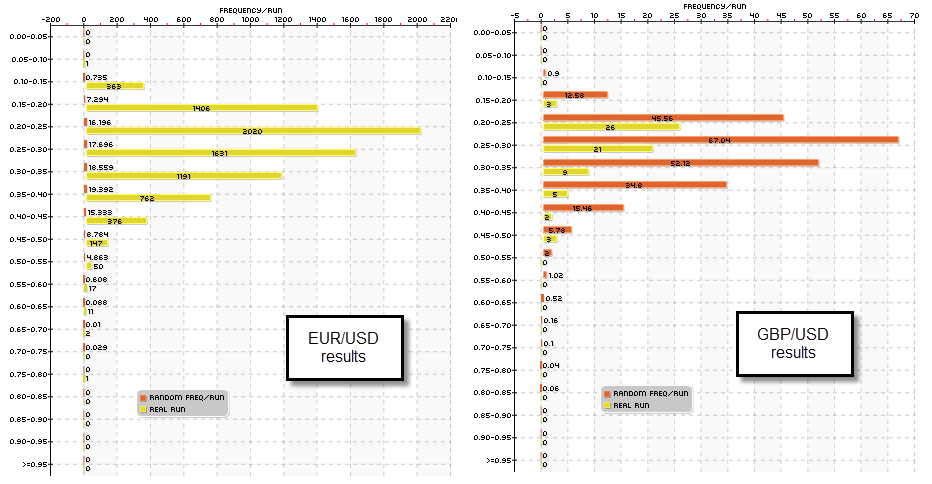
The first image within this post shows you the result of mining for price action strategies on a daily TF for the EUR/USD and the GBP/USD on a particular logic space. The results are shown as a frequency distribution of the profit:drawdown ratio statistic (CAGR to max drawdown ratio). You can see that not only is the number of systems on the EUR/USD much larger but the average number of results on each class is actually much lower for the random data as well. For example while for the 0.35-0.4 class we found 762 systems on the EUR/USD, there were only 9 systems on the GBP/USD. The average random data run generated 19.3 systems for this class on the EUR/USD while there were 34.6 systems generated on the GBP/USD. This means that on the GBP/USD there were on average more systems generated by random chance than those generated from the real data! We therefore have absolutely no ability to distinguish whether the generated systems came from random chance on the GBP/USD mining exercise.
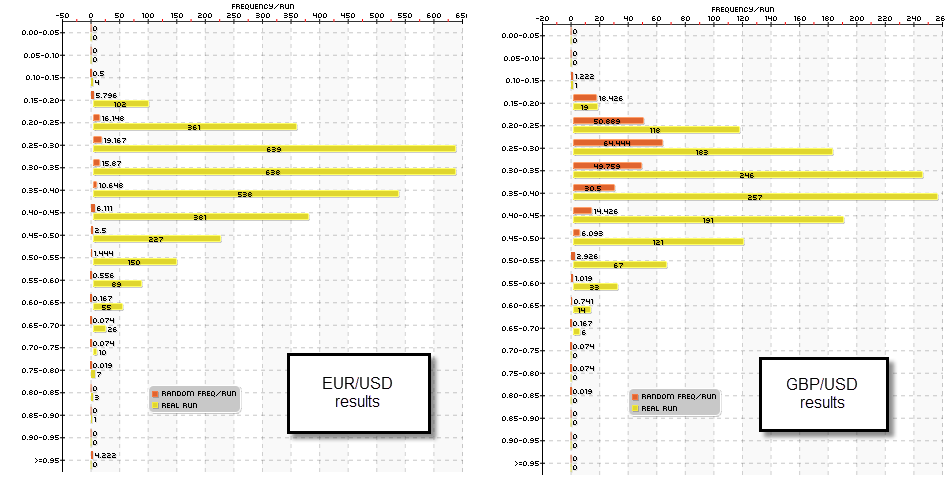
The problem changes as we go into a lower TF. As we move into the 1H TF the amount of systems is reduced for the EUR/USD while the amount of systems increases for the GBP/USD. Note however that the amount of systems derived from random data is fairly constant for both symbols across the 1D and 1H while the number of strategies found on the real data changes significantly. On this experiment (second image) we have a higher data-mining bias for the EUR/USD and a lower data-mining bias for the GBP/USD (vs the 1D experiments), this is showing us that real historical inefficiencies on the GBP/USD might be found more commonly on the recent past, while the EUR/USD inefficiencies might be more broadly distributed (meaning that the deeper past may be more meaningful). This suggests that a good idea to find strategies might be to explore closer shifts on the GBP/USD or move into an even lower TF. These experiments will be underway soon so within a month’s time I’ll be able to tell you if things worked out as I intended.
–
–
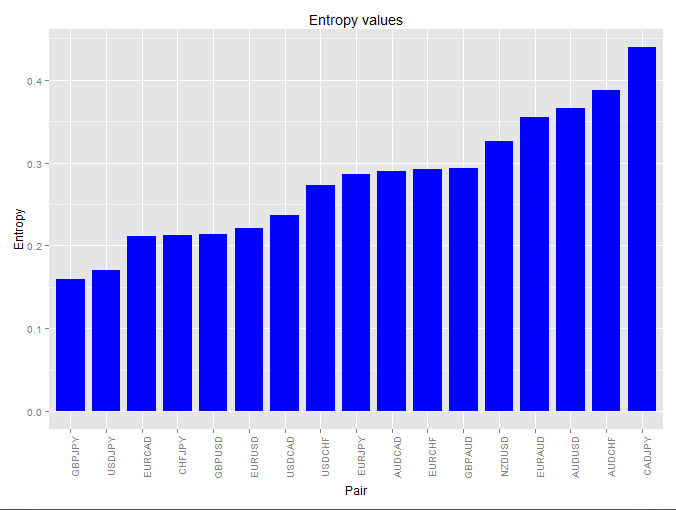
However it is puzzling to me that entropy values for the EUR/USD and the GBP/USD on the daily data are fairly similar (25 year entropy values are 0.093 and 0.11 respectively, 500 day values are also very similar). This implies that there should be some significant opportunity to find non-random behavior (past-to-future causal relationships) on the GBP/USD daily TF while what I find from experiments is precisely the opposite. It may well be that entropy is not directly related with the probability to find systems that follow real historical market inefficiencies.
If you would like to learn more about our cloud based data-mining effort consider joining Asirikuy.com, a website filled with educational videos, trading systems, development and a sound, honest and transparent approach towards automated trading.


