In the past we have discussed how to use the OpenKantu open source trading system generator to perform different types of experiments, such as analyzing IS/OS correlations, finding systems that work across multiple symbols and analyzing the risk to reward ratio from different run configurations. Today we are going to talk about a particularly difficult subject, which is how we can generate strategies on symbols that tend to be difficult to work with, such as the USD/CAD. You will be able to draw some parallels to the last post on this matter, where we talked about the AUD/USD (you can read more here). You will see that there are some substantial similarities between both cases and that this indeed suggests that symbols outside of the 4 majors need to be tackled in a different way due to their different characteristics.
–

–
If you have ever tried to generate systems for the USD/CAD using OpenKantu you’ll notice that it is difficult to arrive at highly linear systems that work in the long term (from 1987 to 2016). If you run an experiment using no TP and just an SL you’ll notice that it is extremely easy to find systems on the EUR/USD, GBP/USD, USD/CHF and the USD/JPY while you will find practically no strategies on the USD/CAD or the AUD/USD. This is because these symbols have not trended in a manner that is so directional as the majors so systems without an SL – where the expected system behavior is trend following – never seem to give good enough results on these pairs. To find systems in these cases we need to allow the search to include systems whose nature is not long term trend following but which are more likely to follow shorter movements.
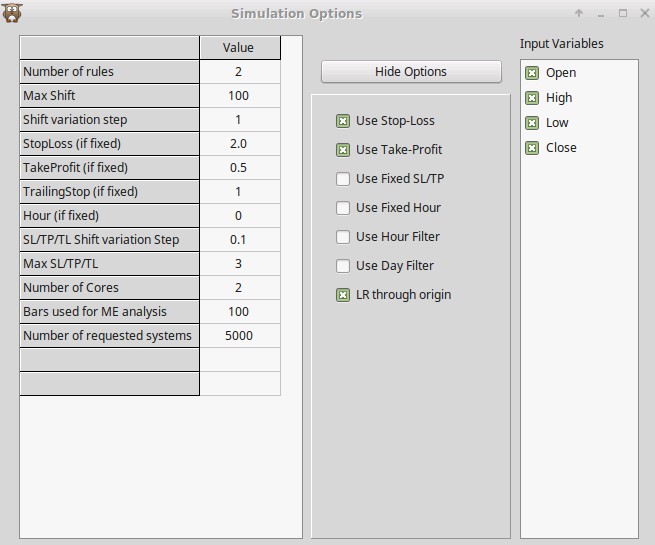
To do this in pKantu you can configure the run as showed in the first image above. What I have done here is make the SL/TP a fine grain search (max 3 in 0.1 steps) and I have also enabled the use of the TP. For this test I used the USDCAD 1D timeframe but if you want to use the 1H you might want to enable the Hour filtering as well to ensure that you can also generate some systems. In the filters options I simply selected systems with more than 10 trades per year and an R²>0.9 which generates systems that are overall stable through the whole generation period and that have a high enough trading frequency as to yield results that have some statistical relevance. Remember also to check the “LR through origin” box as otherwise the linear regression is not forced to cross the initial balance which artificially increases the R² values you get.
–

–
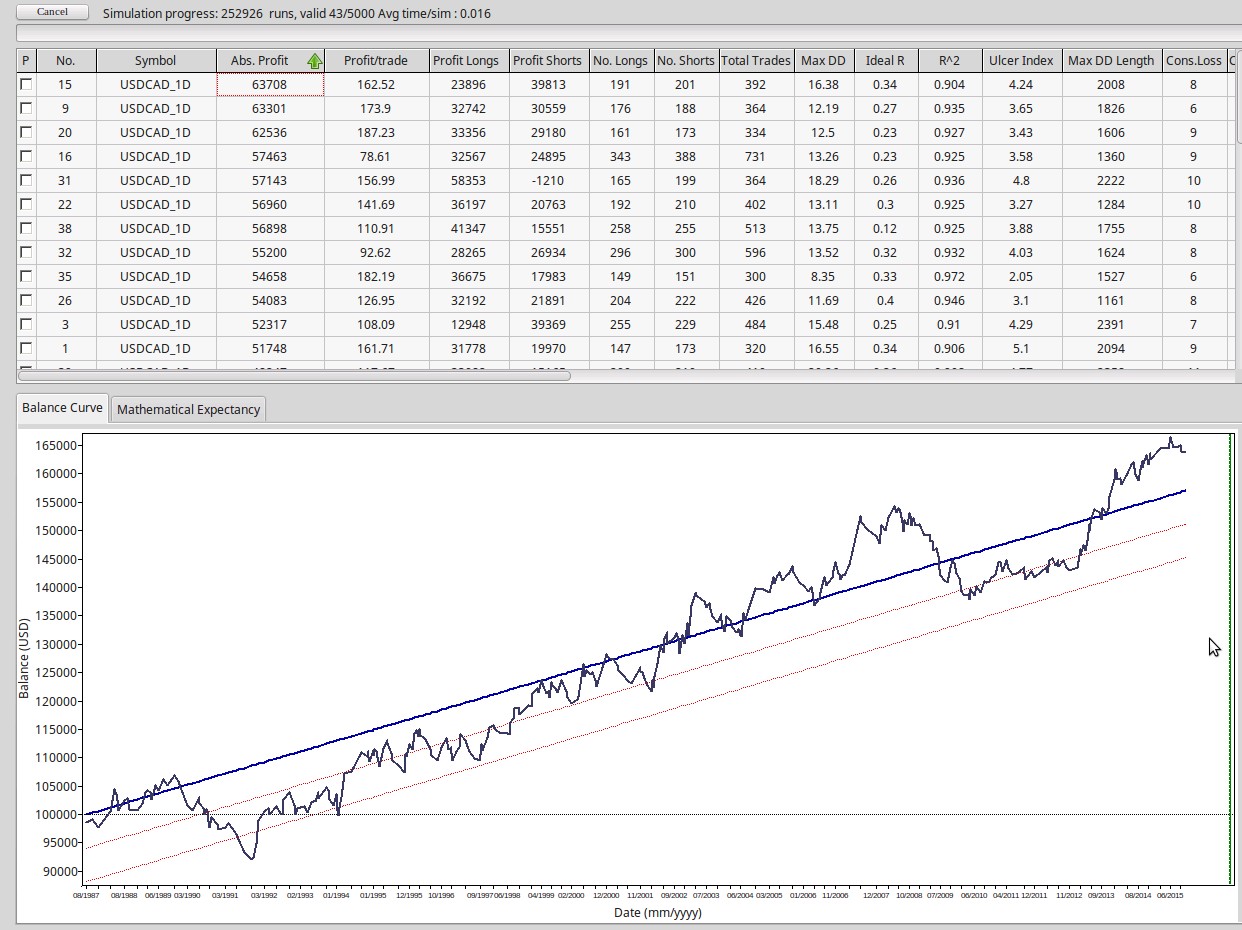
The above image shows some of the generation results obtained. Although the number of systems is still much lower than what you would get for the majors you can see that we can indeed find several system configurations that offer highly linear results. It is also worth noting that this is not only a consequence of the increase in the degrees of freedom – the fact that we allow for a TP – because if you do not allow a TP but increase system complexity by increasing rules, shifts or other variables you do not obtain systems. The fact of the matter is that we find systems because the TP allows for system configurations that act on mean reversion, something that does not exist when we have no TP present.
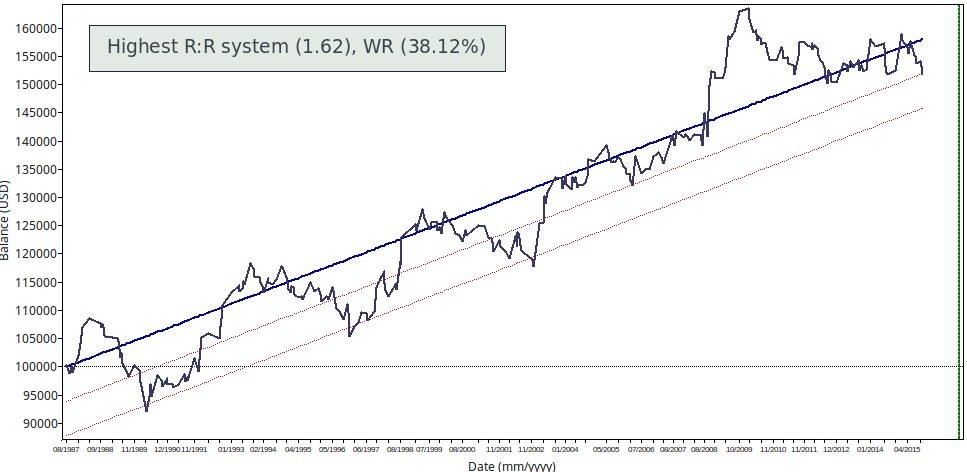
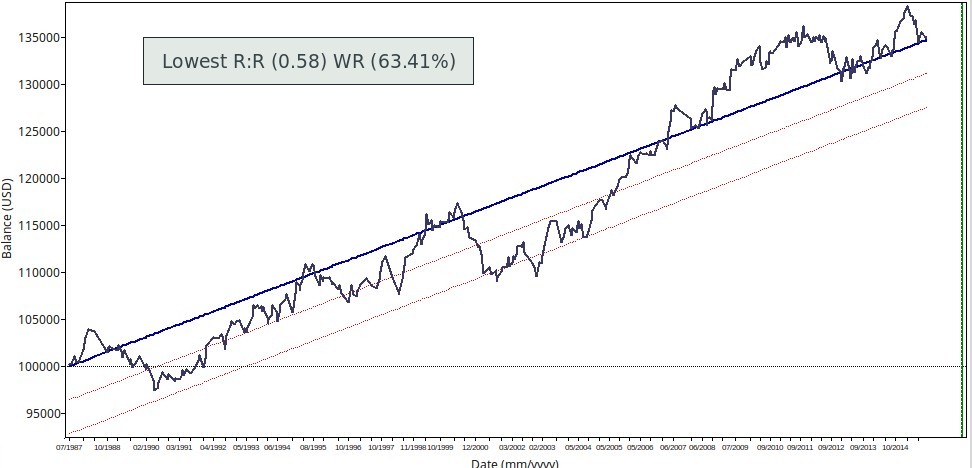
It is also no coincidence that this is the same configuration I suggested in the case of the AUD/USD perhaps with the difference that in this case it is not necessary – in fact it’s detrimental if you do it – to set the Max SL/TP values to 5 instead of 3. However you can see similar ending system makeups and similar overall results. In this case the Reward to Risk ratios are also above 0.5 every time and the winning rates oscillates between 63 and 38%. This means that we still get some systems that arrive at the mark through trend following – as they show classic trend following behavior – only that the extent of the trends they follow is limited by the size of their TP. You can see two images below for a comparison between the lowest and highest R:R systems found within the small search I performed.
–


–
The above configuration will allow you to generate systems for the USD/CAD in the 1D timeframe and the systems you’ll find will tend to capture either trend following or mean reversion. However you’ll notice that the fundamental change that allows for this is the TP which allows this type of systems to be generated. You can also play with the Max SL/TP values or use Fixed SL/TP values to try to find systems that fit a specific range or trend trading profile. If you would like to know more about system generation and how you can trade a repository with more than 3000 trading strategies please consider joining Asirikuy.com, a website filled with educational videos, trading systems, development and a sound, honest and transparent approach towards automated trading.strategies.


